Instantaneous Trend
Download script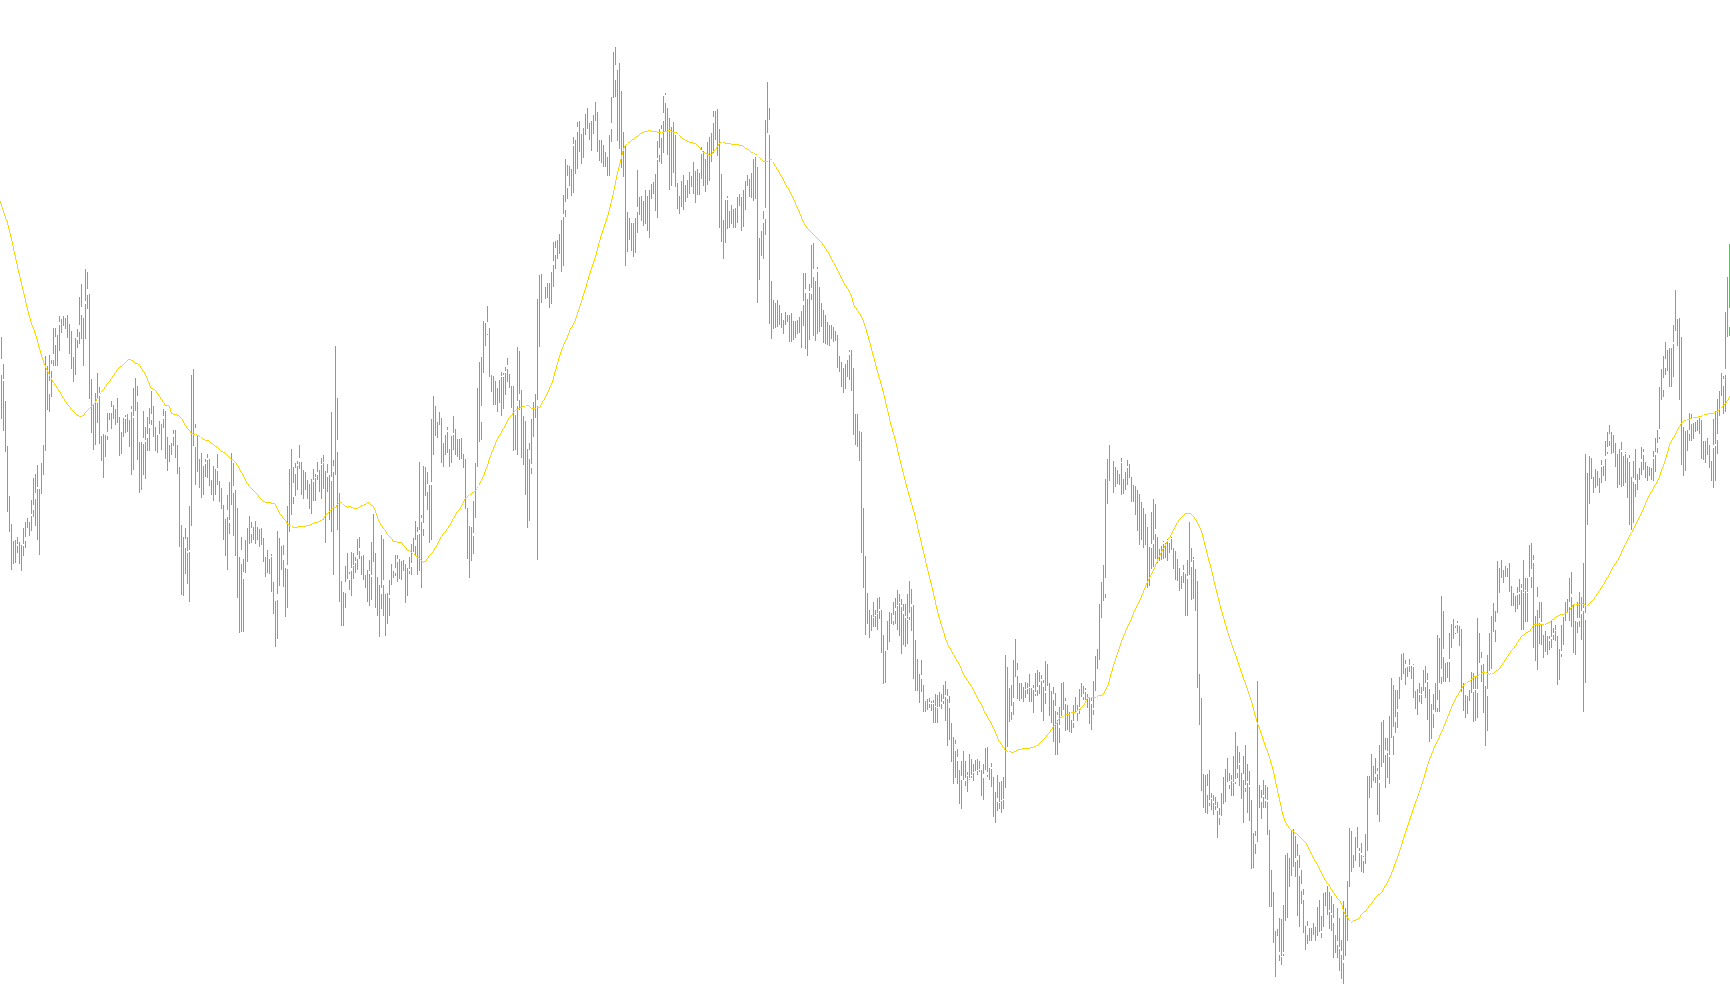
This tool is designed to help traders identify and visualize the underlying trends of a financial market by calculating what it calls an "Instantaneous Trend." Unlike standard moving averages that use a fixed time window (like 50 or 200 periods), this script dynamically adjusts itself based on the current behavior of the price.
How the Logic Works
1. Price Analysis and Component Breakdown The script begins by identifying the midpoint of the price action for each candle. It then breaks down these price movements into two distinct mathematical components: "In-Phase" and "Quadrature." Think of this as separating the movement into its core trend and its cyclical fluctuations. By analyzing the relationship between these two components, the tool can determine the "phase" or the specific position of the market within its current cycle.
2. Dynamic Period Detection Instead of assuming how long a trend lasts, the script calculates the "Delta Phase"—the change in movement from one moment to the next. It continuously sums these changes to determine the "Instantaneous Period." Essentially, the script is asking: “Based on the current rhythm of the market, how long does it take for one full cycle to complete?”
3. Adaptive Smoothing To ensure the data isn't jittery or overly sensitive to minor market noise, the script applies a smoothing filter to this detected period. This prevents the indicator from reacting too violently to sudden, temporary spikes, ensuring that the identified trend remains consistent and reliable for the user.
4. Trendline Construction Once the script knows the "Instantaneous Period" (the length of the current dominant cycle), it calculates a trendline. It does this by taking a simple average of the price over that specific, dynamically calculated period. Because the period changes as the market's rhythm changes, the resulting trendline adapts in real-time to whether the market is moving in a slow, long-wave cycle or a fast, short-wave cycle.
5. Output Visualization The final result provides two distinct visual outputs:
- The Instantaneous Trend: A primary line representing the smoothed average of the current dominant cycle.
- A Secondary Value: An additional calculation that helps refine the price action by blending current prices with slightly older data points to provide a clearer picture of momentum.
Summary for the User
In simple terms, this tool "listens" to the heartbeat of the market. It automatically detects how fast or slow the current price cycle is moving and then draws a trendline based on that specific speed. This allows traders to see the primary direction of the market without having to manually guess which moving average period is currently most appropriate for the prevailing conditions.
//+------------------------------------------------------------------+
//|                          Instantaneous Trend Line by John Ehlers |
//|                               Copyright © 2004, Poul_Trade_Forum |
//|                                                         Aborigen |
//|                                          http://forex.kbpauk.ru/ |
//+------------------------------------------------------------------+
#property copyright "Poul Trade Forum"
#property link      "http://forex.kbpauk.ru/"
#property indicator_separate_window
#property indicator_buffers 2
#property indicator_color1 Red
#property indicator_color2 Blue

//---- buffers
double TRBuffer[];
double ZLBuffer[];
double Value1[],Value2,Value3,Value4,Value5[2],Value11[2];
double Price[],InPhase[2],Quadrature[2],Phase[2],DeltaPhase[],InstPeriod[2],Period_,Trendline;
double test[];

//+------------------------------------------------------------------+
//| Custom indicator initialization function                         |
//+------------------------------------------------------------------+
int init()
  {
   string short_name;

   IndicatorBuffers(5);
//---- indicator line
   SetIndexStyle(0,DRAW_LINE,EMPTY,1,Gold);
   SetIndexStyle(1,DRAW_LINE,EMPTY,1,White);

   SetIndexBuffer(0,TRBuffer);
   SetIndexBuffer(1,ZLBuffer);
   SetIndexBuffer(2,Value1);
   SetIndexBuffer(3,Price);
   SetIndexBuffer(4,DeltaPhase);


   SetIndexEmptyValue(0,0);
   SetIndexEmptyValue(1,0);

//---- name for DataWindow and indicator subwindow label
   short_name="Instantaneous Trend";
   IndicatorShortName(short_name);
   SetIndexLabel(0,short_name);

//----
   SetIndexDrawBegin(0,30);
   SetIndexDrawBegin(1,30);
//----


   return(0);
  }
//+------------------------------------------------------------------+
//| Custor indicator deinitialization function                       |
//+------------------------------------------------------------------+
int deinit()
  {
//---- TODO: add your code here

//----
   return(0);
  }
//+------------------------------------------------------------------+
//| Custom indicator iteration function                              |
//+------------------------------------------------------------------+
int start()
  {
   int    counted_bars=IndicatorCounted(),i,shift,count;


//---- TODO: add your code here
if (counted_bars==0) counted_bars=100;

i=(Bars-counted_bars)-2;

for (shift=i; shift>=0;shift--)
{

InPhase[1] =InPhase[0]; Quadrature[1] =Quadrature[0];
Phase[1]=Phase[0]; InstPeriod[1] = InstPeriod[0];
Value5[1] =Value5[0];Value11[1] =Value11[0];

Price[shift]=(High[shift+1]+Low[shift+1])/2;

//  {Compute InPhase and Quadrature components}
   Value1[shift] = Price[shift] - Price[shift+6];
   Value2 =Value1[shift+3];
   Value3 =0.75*(Value1[shift] - Value1[shift+6]) + 0.25*(Value1[shift+2] - Value1[shift+4]);
   InPhase[0] = 0.33*Value2 + 0.67*InPhase[1];
   Quadrature[0] = 0.2*Value3 + 0.8*Quadrature[1];

//   {Use ArcTangent to compute the current phase}
if (MathAbs(InPhase[0]+InPhase[1])>0) Phase[0]=MathArctan(MathAbs((Quadrature[0]+Quadrature[1])/(InPhase[0]+InPhase[1])));

//   {Resolve the ArcTangent ambiguity}
   if (InPhase[0] < 0 && Quadrature[0] > 0)  Phase[0] = 180 - Phase[0];
   if (InPhase[0] < 0 && Quadrature[0] < 0)  Phase[0] = 180 + Phase[0];
   if (InPhase[0] > 0 && Quadrature[0] < 0)  Phase[0] = 360 - Phase[0];

//   {Compute a differential    phase, resolve phase wraparound, and limit delta phase errors}
   DeltaPhase[shift] = Phase[1] - Phase[0];

   if (Phase[1] < 90 &&  Phase[0] > 270) DeltaPhase[shift] = 360 + Phase[1] - Phase[0];
   if (DeltaPhase[shift] < 1)  DeltaPhase[shift] = 1;
   if (DeltaPhase[shift] > 60) DeltaPhase[shift] = 60;

//   {Sum DeltaPhases  to reach 360  degrees. The sum is the instantaneous period.}
   InstPeriod[0] = 0;
   Value4 = 0;
   for (count = 0;count<=40;count++)
      {
       Value4 = Value4 + DeltaPhase[shift+count];
       if  (Value4 > 360 && InstPeriod[0]  == 0) InstPeriod[0] = count;
     }

//   {Resolve Instantaneous  Period    errors and  smooth}
   if (InstPeriod[0] == 0) InstPeriod[0] = InstPeriod[1];
   Value5[0] = 0.25*(InstPeriod[0]) + 0.75*Value5[1];

//   {Compute Trendline as simple average over the measured dominant cycle period}
   Period_ = MathCeil(Value5[0]); Trendline = 0;///Period_ = IntPortion(Value5)

   for    (count = 0;count<=Period_ + 1;count++)
       { Trendline = Trendline + Price[shift+count]; }


   if (Period_ > 0) Trendline = Trendline    / (Period_  + 2);
   Value11[0] = 0.33*(Price[shift] + 0.5*(Price[shift] - Price[shift+3])) + 0.67*Value11[1];

   TRBuffer[shift]=Trendline;
   ZLBuffer[shift]=Value11[0];


//----

}

   return(0);
  }
//+------------------------------------------------------------------+
Comments