InsTrend
Download script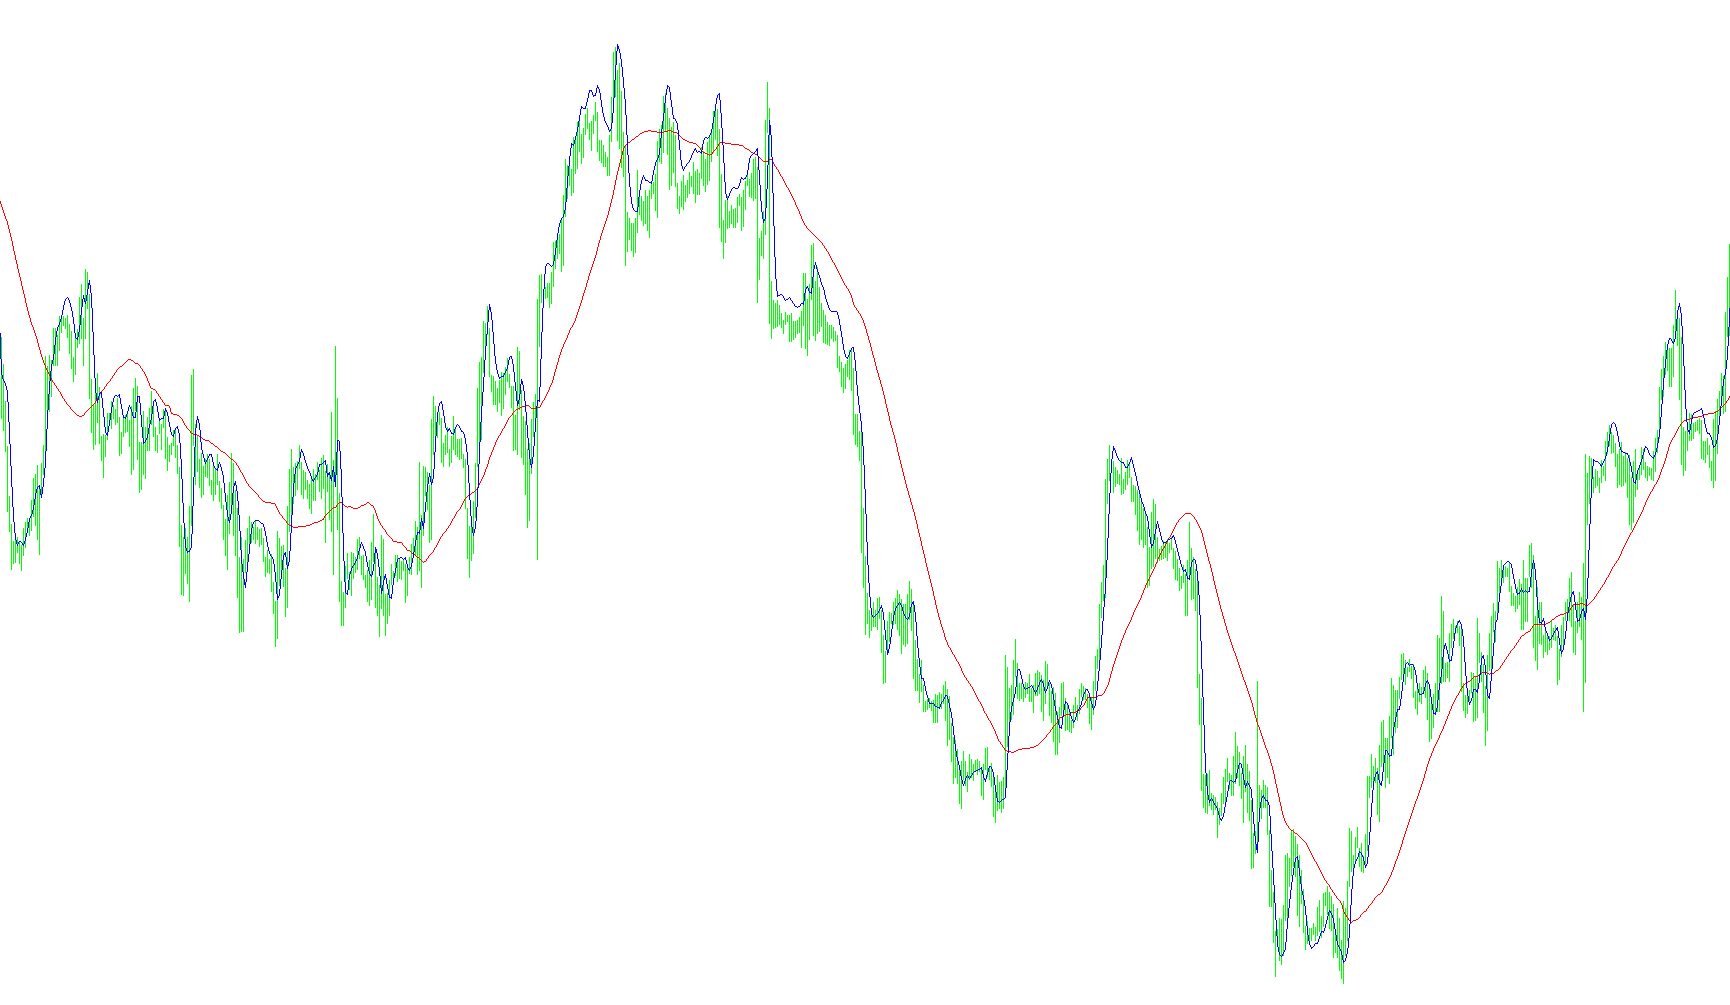
This tool is designed to analyze market trends by identifying the "heartbeat" of price movements. Rather than looking at simple averages, it attempts to calculate the underlying cycle or rhythm of the market in real-time to provide a more responsive view of where the price is heading.
How the Logic Works
1. Identifying Movement Rhythms The script begins by analyzing the relationship between current prices and previous prices. Instead of just looking at whether the price went up or down, it breaks the movement into complex mathematical components (referred to as "InPhase" and "Quadrature"). This allows the tool to treat price action like a wave, identifying the frequency and speed of the market's oscillations.
2. Calculating the Instantaneous Period One of the most unique features of this logic is its ability to calculate an "Instantaneous Period." In many markets, trends don't last for a fixed amount of time; they can speed up or slow down. This script measures how long it takes for a specific cycle of price movement to complete (a full 360-degree rotation of the wave). By constantly measuring this, the tool "learns" the current dominant cycle of the market at any given moment.
3. Dynamic Trend Smoothing Once the tool determines the length of the current dominant cycle, it uses that specific information to create a trend line. It takes a simple average of the prices over that calculated period. Because the period is "instantaneous," the resulting trend line adjusts its sensitivity automatically:
- If the market cycle is fast and short, the trend line reacts more quickly.
- If the market cycle is slow and long, the trend line becomes smoother and broader.
4. Dual Visual Outputs The script produces two primary visual elements to help the user distinguish between different types of price data:
- The Trend Line: This represents the calculated average based on the dynamic cycle length identified by the algorithm.
- The Zero-Lag Component: The script also calculates a specialized smoothed price value designed to reduce the typical "lag" found in standard moving averages, providing a closer look at the immediate price action.
Summary for the User
Essentially, this indicator acts like an intelligent observer that measures the "speed" of the market. By figuring out how fast the market is currently cycling, it adjusts its own calculation window to match that speed, aiming to provide a trend line that feels more synchronized with the actual behavior of the price rather than being stuck on a fixed, static setting.
//+------------------------------------------------------------------+
//|                          Instantaneous Trend Line by John Ehlers |
//|                               Copyright © 2004, Poul_Trade_Forum |
//|                                                         Aborigen |
//|                                          http://forex.kbpauk.ru/ |
//+------------------------------------------------------------------+
#property copyright "Poul Trade Forum"
#property link      "http://forex.kbpauk.ru/"
#property indicator_separate_window
#property indicator_buffers 2
#property indicator_color1 Red
#property indicator_color2 Blue

//---- buffers
double TRBuffer[];
double ZLBuffer[];
double Value1[];
double Price[];
double DeltaPhase[];
//----
double Value2, Value3, Value4, Value5[2], Value11[2];
double InPhase[2], Quadrature[2], Phase[2];
double InstPeriod[2], Period_, Trendline;
double test[];

//+------------------------------------------------------------------+
//| Custom indicator initialization function                         |
//+------------------------------------------------------------------+
int init()
  {
   string short_name;
//----
   IndicatorBuffers(5);
//---- indicator line
   SetIndexStyle(0, DRAW_LINE, EMPTY, 1, Red);
   SetIndexStyle(1, DRAW_LINE, EMPTY, 1, Blue);
//----
   SetIndexBuffer(0, TRBuffer);
   SetIndexBuffer(1, ZLBuffer);
   SetIndexBuffer(2, Value1);
   SetIndexBuffer(3, Price);
   SetIndexBuffer(4, DeltaPhase);
//----
   SetIndexEmptyValue(0, 0);
   SetIndexEmptyValue(1, 0);
//---- name for DataWindow and indicator subwindow label
   short_name="InsTrend";
   IndicatorShortName(short_name);
   SetIndexLabel(0,short_name);
//----
   SetIndexDrawBegin(0, 30);
   SetIndexDrawBegin(1, 30);
//----
   return(0);
  }
//+------------------------------------------------------------------+
//| Custor indicator deinitialization function                       |
//+------------------------------------------------------------------+
int deinit()
  {
//----
   return(0);
  }
//+------------------------------------------------------------------+
//| Custom indicator iteration function                              |
//+------------------------------------------------------------------+
int start()
  {
   int counted_bars = IndicatorCounted(), i, shift, count;
//----
   if(counted_bars == 0)
       counted_bars = 100;
//----
   i = (Bars - counted_bars) - 2;
   for(shift = i; shift >= 0; shift--)
     {
       InPhase[1] = InPhase[0];
       Quadrature[1] = Quadrature[0];
       Phase[1] = Phase[0];
       InstPeriod[1] = InstPeriod[0];
       Value5[1] = Value5[0];
       Value11[1] = Value11[0];
       Price[shift] = (High[shift+1] + Low[shift+1]) / 2;
//  {Compute InPhase and Quadrature components}
       Value1[shift] = Price[shift] - Price[shift+6];
       Value2 = Value1[shift+3];
       Value3 =0.75*(Value1[shift] - Value1[shift+6]) +
               0.25*(Value1[shift+2] - Value1[shift+4]);
       InPhase[0] = 0.33*Value2 + 0.67*InPhase[1];
       Quadrature[0] = 0.2*Value3 + 0.8*Quadrature[1];
//   {Use ArcTangent to compute the current phase}
       if(MathAbs(InPhase[0] + InPhase[1]) > 0)
           Phase[0] = MathArctan(MathAbs((Quadrature[0] + Quadrature[1]) /
                      (InPhase[0] + InPhase[1])));
//   {Resolve the ArcTangent ambiguity}
       if(InPhase[0] < 0 && Quadrature[0] > 0)
           Phase[0] = 180 - Phase[0];
       if(InPhase[0] < 0 && Quadrature[0] < 0)
           Phase[0] = 180 + Phase[0];
       if(InPhase[0] > 0 && Quadrature[0] < 0)
           Phase[0] = 360 - Phase[0];
//   {Compute a differential    phase, resolve phase wraparound, and limit delta phase errors}
       DeltaPhase[shift] = Phase[1] - Phase[0];
       if (Phase[1] < 90 &&  Phase[0] > 270)
           DeltaPhase[shift] = 360 + Phase[1] - Phase[0];
       if(DeltaPhase[shift] < 1)
           DeltaPhase[shift] = 1;
       if(DeltaPhase[shift] > 60)
           DeltaPhase[shift] = 60;
//   {Sum DeltaPhases  to reach 360  degrees. The sum is the instantaneous period.}
       InstPeriod[0] = 0;
       Value4 = 0;
       for(count = 0; count <= 40; count++)
         {
           Value4 = Value4 + DeltaPhase[shift+count];
           if(Value4 > 360 && InstPeriod[0] == 0)
               InstPeriod[0] = count;
         }
       //   {Resolve Instantaneous  Period    errors and  smooth}
       if(InstPeriod[0] == 0)
           InstPeriod[0] = InstPeriod[1];
       Value5[0] = 0.25*(InstPeriod[0]) + 0.75*Value5[1];
       //   {Compute Trendline as simple average over the measured dominant cycle period}
       Period_ = MathCeil(Value5[0]);
       Trendline = 0; //Period_ = IntPortion(Value5)
//----
       for(count = 0; count <= Period_ + 1; count++)
         {
           Trendline = Trendline + Price[shift+count];
         }
       if(Period_ > 0)
           Trendline = Trendline / (Period_ + 2);
       Value11[0] = 0.33*(Price[shift] + 0.5*(Price[shift] -
                    Price[shift+3])) + 0.67*Value11[1];
       TRBuffer[shift]=Trendline;
       ZLBuffer[shift]=Value11[0];
     }
//----
   return(0);
  }
//+------------------------------------------------------------------+
Comments