iPip_Tom_DeMark_Pivot
Download script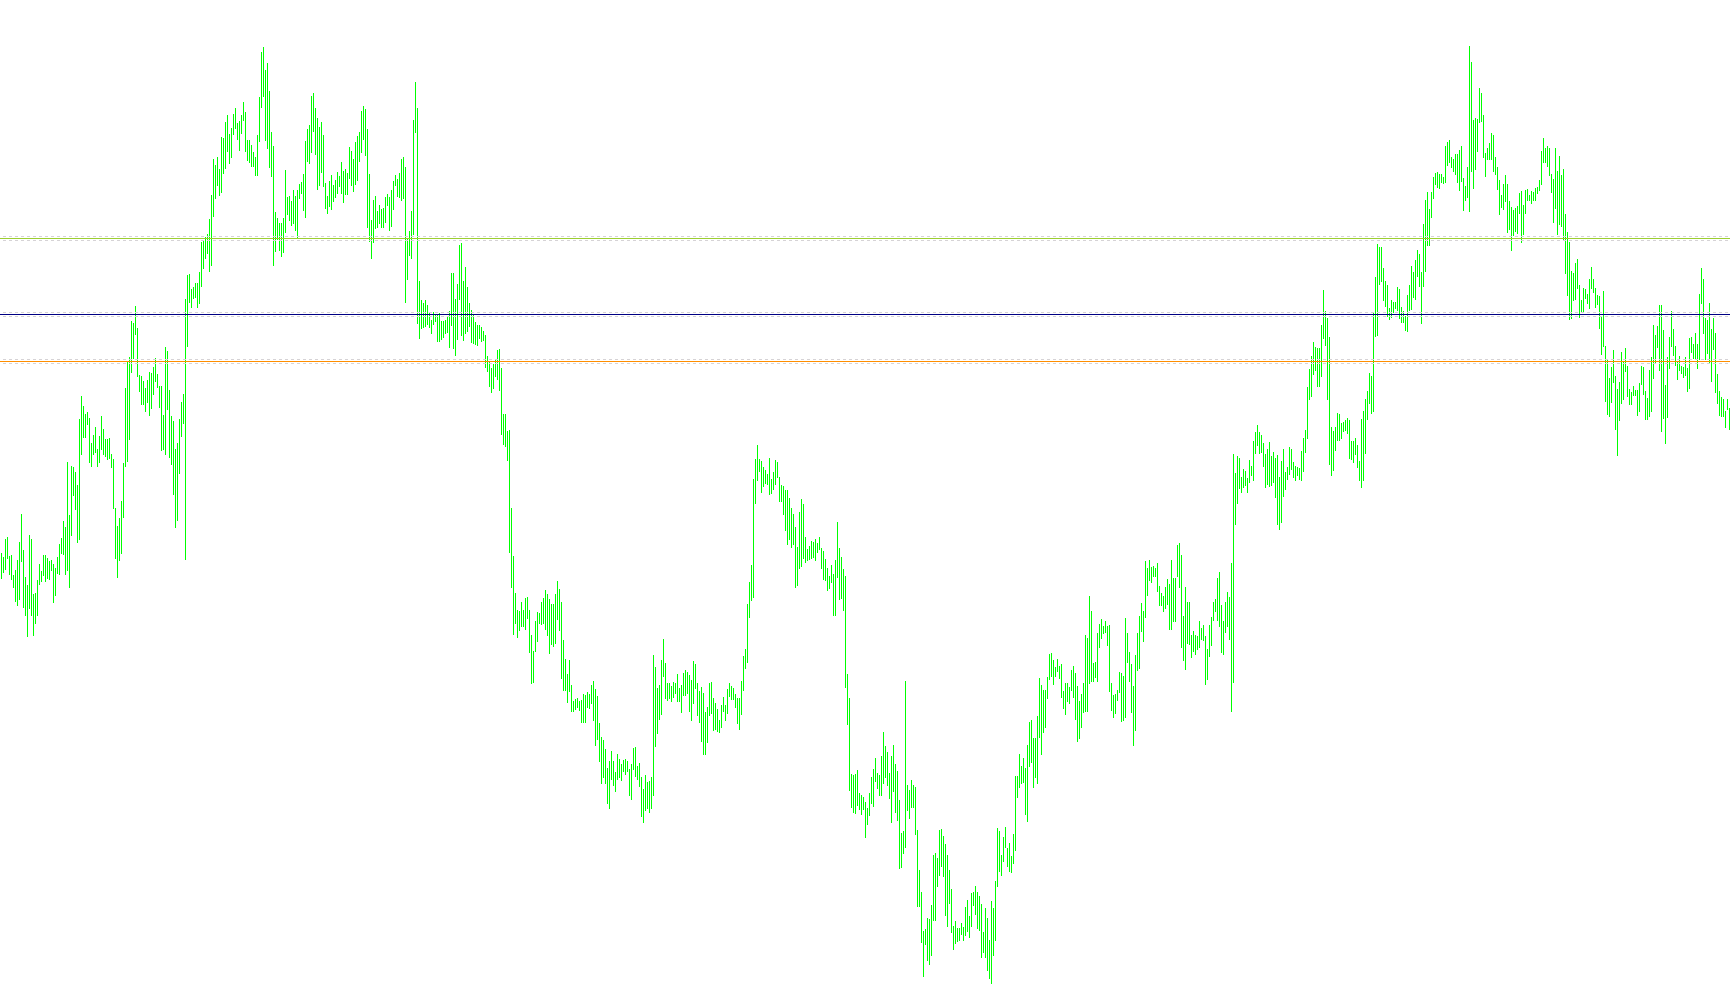
This script is designed to automatically identify and display key price levels on your trading chart based on the Tom DeMark's Pivot methodology. It serves as a visual guide to help traders identify potential support, resistance, and equilibrium points for the current day based on the prior day's market activity.
Core Logic Overview
The script operates by analyzing the previous full trading day to calculate three primary price levels: a High, a Low, and a Pivot point. Unlike standard pivot calculations that use a simple average, this logic adjusts its calculation based on the "sentiment" of the previous day's close relative to its opening price.
How the Calculations Work
The script follows a specific set of rules to determine where the current day's price levels should sit:
- The Pivot Point: This is the central equilibrium line for the day. The script looks at whether the previous day ended higher or lower than it started:
- If the previous day closed lower than it opened (Bearish), it gives more weight to the day's low price in its calculation.
- If the previous day closed higher than it opened (Bullish), it gives more weight to the day's high price.
- If there was no movement, it balances the weight between the closing prices.
- The High and Low Levels: Once the Pivot is established, the script calculates the "New High" and "New Low" by projecting these values relative to the Pivot. These represent the expected boundaries of the current trading session.
Visual Representation on Chart
To make this data easy to read at a glance, the script performs the following actions:
- Dynamic Updates: The script automatically refreshes its calculations every time a new day begins, ensuring your levels are always current.
- Level Drawing: It draws three main horizontal lines on your chart:
- High Line: Indicates the projected upper boundary.
- Pivot Line: Shows the central balance point of the market.
- Low Line: Indicates the projected lower boundary.
- Visual Guides: For better precision, the script includes "buffer" zones (dotted lines) slightly above and below each main level. This helps traders see the area around a price point rather than just a single, thin line.
- Automatic Cleanup: Every time the calculation runs for a new day, the script automatically clears out the old lines from the previous day to keep your chart clean and uncluttered.
//+------------------------------------------------------------------+
//|                                      iPip Tom DeMark's Pivot.mq4 |
//|                                     Copyright © 2006, ForexRulez |
//|                                        http://www.forexrulez.com |
//+------------------------------------------------------------------+

#define VSInfo "vs 1.01"

#property copyright "Copyright © 2006, ForexRulez"
#property link      "http://www.forexrulez.com"

#property indicator_chart_window

extern bool ShowMidPivots = True;
extern color clPivot = Navy;
extern color clHigh = YellowGreen;
extern color clLow = DarkOrange;

datetime LastCalcPivot=0;
int u=0,d=0,s=0,uu=0,dd=0,ss=0;
int init(){

   Comment(VSInfo);
   start();

   return(0);
}

int deinit(){

   ClearGraph();
   Comment("");

   return(0);
}

int start(){
   if (LastCalcPivot != Time[0]){
      CalcPivot();
      LastCalcPivot = Time[0];
   }

   return(0);
}

void CalcPivot(){

   int i = 1;

   while (TimeDayOfWeek(iTime(NULL, PERIOD_D1, i))==0) i++;


   double Pivot = 0;
   if (iClose(NULL, PERIOD_D1, i) < iOpen(NULL, PERIOD_D1, i))
   Pivot = (iHigh(NULL, PERIOD_D1, i)
          + iLow(NULL, PERIOD_D1, i)
          + iClose(NULL, PERIOD_D1, i)
          + iLow(NULL, PERIOD_D1, i))
          /4;
   else if (iClose(NULL, PERIOD_D1, i) > iOpen(NULL, PERIOD_D1, i))
   Pivot = (iHigh(NULL, PERIOD_D1, i)
          + iLow(NULL, PERIOD_D1, i)
          + iClose(NULL, PERIOD_D1, i)
          + iHigh(NULL, PERIOD_D1, i))
          /4;
   else
   Pivot = (iHigh(NULL, PERIOD_D1, i)
          + iLow(NULL, PERIOD_D1, i)
          + iClose(NULL, PERIOD_D1, i)
          + iClose(NULL, PERIOD_D1, i))
          /4;

   double NewHigh = 2*Pivot - iLow(NULL, PERIOD_D1, i);
   double NewLow = 2*Pivot - iHigh(NULL, PERIOD_D1, i);

   ClearGraph();

   CreateLine(NewHigh+5*Point, "", "HL+5", "H+5", LightGray, STYLE_DOT);
   CreateLine(NewHigh, "High", "HLine", "HText", clHigh, STYLE_SOLID);
   CreateLine(NewHigh-5*Point, "", "HL-5", "H-5", LightGray, STYLE_DOT);

   CreateLine(Pivot+5*Point, "", "PL+5", "P+5", LightGray, STYLE_DOT);
   CreateLine(Pivot, "Pivot", "PivotLine", "PivotText", clPivot, STYLE_SOLID);
   CreateLine(Pivot-5*Point, "", "PL-5", "P-5", LightGray, STYLE_DOT);

   CreateLine(NewLow+5*Point, "", "LL+5", "L+5", LightGray, STYLE_DOT);
   CreateLine(NewLow, "Low", "LLine", "LText", clLow, STYLE_SOLID);
   CreateLine(NewLow-5*Point, "", "LL-5", "L-5", LightGray, STYLE_DOT);


}

void ClearGraph(){
   ObjectDelete("HLine"); ObjectDelete("HText");
   ObjectDelete("HL+5");  ObjectDelete("H+5");
   ObjectDelete("HL-5");  ObjectDelete("H-5");

   ObjectDelete("PivotLine"); ObjectDelete("PivotText");
   ObjectDelete("PL+5");  ObjectDelete("P+5");
   ObjectDelete("PL-5");  ObjectDelete("P-5");

   ObjectDelete("LLine"); ObjectDelete("LText");
   ObjectDelete("LL+5");  ObjectDelete("L+5");
   ObjectDelete("LL-5");  ObjectDelete("L-5");
}

void CreateLine(double aValue, string aText, string aLineName, string aTextName, color aColor, int aStyle){
   ObjectCreate(aTextName, OBJ_TEXT, 0, Time[0], aValue);
   ObjectSetText(aTextName, aText, 8, "Arial", EMPTY);

   ObjectCreate(aLineName, OBJ_HLINE, 0, 0, aValue);
   ObjectSet(aLineName, OBJPROP_STYLE, aStyle);
   ObjectSet(aLineName, OBJPROP_COLOR, aColor);
}
Comments