Itrend Old
Download script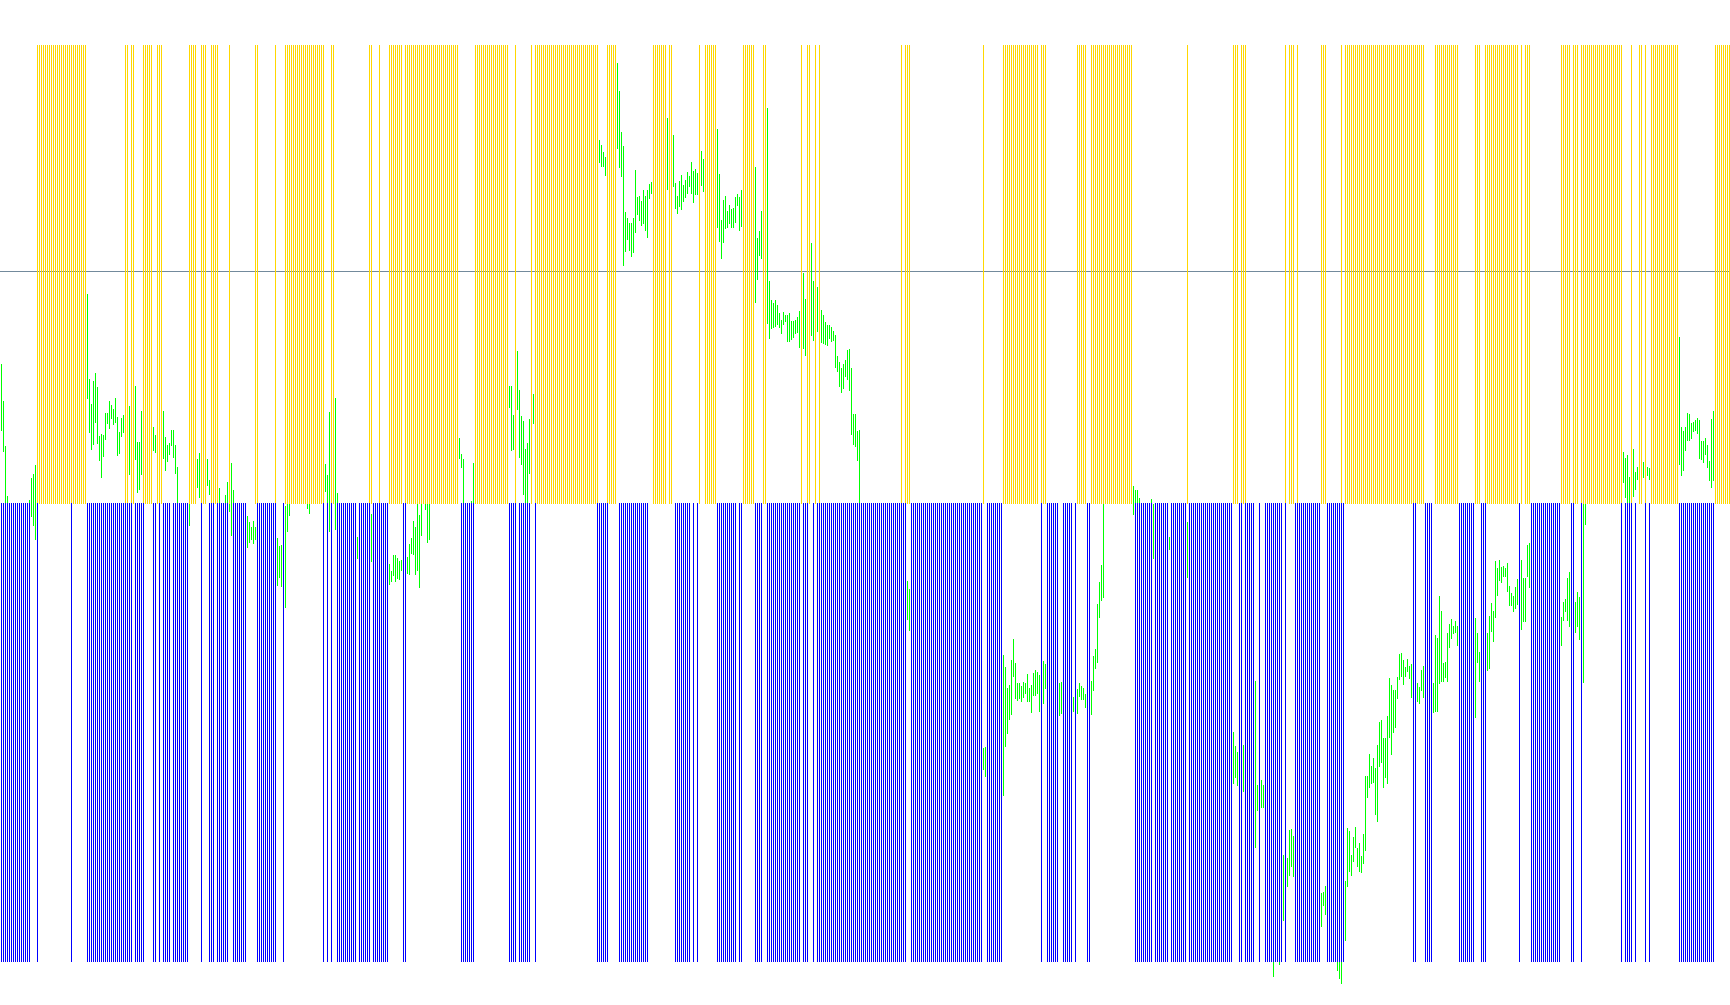
The Traditional Itrend is a technical analysis tool designed to help traders identify market direction and momentum by visualizing price action relative to specific volatility boundaries. Unlike standard indicators that might only show a single line, this script uses a dual-histogram approach to provide a clearer picture of "Bullish" versus "Bearish" environments.
Core Logic and Functionality
The tool operates by processing historical price data through three primary lenses:
1. Dynamic Volatility Boundaries (Bollinger Band Integration) The script utilizes an underlying Bollinger Band logic to establish market boundaries. It looks at a specific period of time (defaulting to 20 bars) and calculates a deviation from the average price. By adjusting the "Mode" settings, users can choose whether the indicator focuses on the high, low, or main median of these bands. This helps the script understand where the current price sits in relation to expected volatility.
2. Price Strength Analysis (Power Indicators) To determine the strength of the move, the script calculates the "Power" of both Bulls and Bears. It evaluates this power based on a user-defined period (defaulting to 14) and can be customized to look at various price points, such as the Open, High, Low, Median, Typical, or Weighted prices. This allows the tool to weigh different types of market activity—for example, focusing on the highest highs vs. the closing price.
3. The Dual Histogram Output The logic culminates in two distinct visual outputs displayed in a separate window:
- Bullish Momentum (Blue): If the current price is significantly above its calculated boundary, the script identifies a positive trend and reflects this as a value of 1.
- Bearish Momentum (Red): If the strength of the "Bears" outweighs the "Bulls" in a specific manner, the script identifies a negative trend and reflects this as a value of -1.
Key Behavior Summary
- Binary Signaling: The indicator simplifies complex market data into binary signals (High/Low or Positive/Negative). This makes it easier for a trader to see at a glance whether the momentum is shifting.
- Customizable Inputs: The script is highly flexible, allowing users to choose which specific price type (e.g., Close, High, Low) dictates the "Power" and "Trend" calculations.
- Real-time Processing: It scans through the chart history to ensure that the current trend displayed is consistent with previous market movements, providing a continuous visual flow of market sentiment.
//+------------------------------------------------------------------+
//|                                           Traditional Itrend.mq4 |
//| TREND INDICATOR                                                  |
//|                                                                  |
//|                                           Conversion: Dr. Gaines |
//|                                  dr_richard_gaines@yahoo.com
//|                                     |
//+------------------------------------------------------------------+

#property copyright " Andrew "
#property link      " http://anri.aney.ru/forex/ "

#property indicator_separate_window
#property indicator_color1 Blue
#property indicator_buffers 2
#property indicator_color2 Red
#include <stdlib.mqh>
//+------------------------------------------------------------------+
//| Common External variables                                        |
//+------------------------------------------------------------------+

//+------------------------------------------------------------------+
//| External variables                                               |
//+------------------------------------------------------------------+
extern double iBands_Mode_0_2 = 0;
extern double iPower_Price_0_6 = 0;
extern double iPrice_Type_0_3 = 0;
extern double iBands_Period = 20;
extern double iBands_Deviation = 2;
extern double iPower_Period = 14;

//+------------------------------------------------------------------+
//| Special Convertion Functions                                     |
//+------------------------------------------------------------------+

int LastTradeTime;
double ExtHistoBuffer[];
double ExtHistoBuffer2[];

void SetLoopCount(int loops)
{
}

void SetIndexValue(int shift, double value)
{
  ExtHistoBuffer[shift] = value;
}

void SetIndexValue2(int shift, double value)
{
  ExtHistoBuffer2[shift] = value;
}

//+------------------------------------------------------------------+
//| End                                                              |
//+------------------------------------------------------------------+

//+------------------------------------------------------------------+
//| Initialization                                                   |
//+------------------------------------------------------------------+

int init()
{
   SetIndexStyle(0, DRAW_HISTOGRAM, STYLE_SOLID);
   SetIndexBuffer(0, ExtHistoBuffer);
   SetIndexStyle(1, DRAW_HISTOGRAM, STYLE_SOLID);
   SetIndexBuffer(1, ExtHistoBuffer2);
   return(0);
}
int start()
{
//+------------------------------------------------------------------+
//| Local variables                                                  |
//+------------------------------------------------------------------+
double value = 0;
double value2 = 0;
int CurrentBar = 0;
double Bands_Mode = 0;
double Power_Price = 0;
double CurrentPrice = 0;

/*[[
Name := iTrend 1.01
Author := Andrew
Link := http://anri.aney.ru/forex/
Notes := TREND INDICATOR
Separate Window := YES
First Color := blue
First Draw Type := histogram
First Symbol := 217
Use Second Data := Yes
Second Color := red
Second Draw Type := histogram
Second Symbol := 218
]]*/
 // =0-2 MODE_MAIN, MODE_LOW, MODE_HIGH
 // =0-6 PRICE_CLOSE,PRICE_OPEN,PRICE_HIGH,PRICE_LOW,PRICE_MEDIAN,PRICE_TYPICAL,PRICE_WEIGHTED
 // =0-3 PRICE_CLOSE,PRICE_OPEN,PRICE_HIGH,PRICE_LOW
//20

//13


SetLoopCount(0);
if( iBands_Mode_0_2 == 1 ) Bands_Mode=MODE_LOW
; else if( iBands_Mode_0_2 == 2 ) Bands_Mode=MODE_HIGH
; else Bands_Mode=MODE_MAIN;

if( iPower_Price_0_6 == 1 ) Power_Price=PRICE_OPEN
; else if( iPower_Price_0_6 == 2 ) Power_Price=PRICE_HIGH
; else if( iPower_Price_0_6 == 3 ) Power_Price=PRICE_LOW
; else if( iPower_Price_0_6 == 4 ) Power_Price=PRICE_MEDIAN
; else if( iPower_Price_0_6 == 5 ) Power_Price=PRICE_TYPICAL
; else if( iPower_Price_0_6 == 6 ) Power_Price=PRICE_WEIGHTED
; else Power_Price=PRICE_CLOSE;

for(CurrentBar=Bars+1;CurrentBar>=0 ;CurrentBar--){
if( iPrice_Type_0_3 == 1 ) CurrentPrice=Open[CurrentBar]
; else if( iPrice_Type_0_3 == 2 ) CurrentPrice=High[CurrentBar]
; else if( iPrice_Type_0_3 == 3 ) CurrentPrice=Low[CurrentBar]
; else CurrentPrice=Close[CurrentBar];
value=CurrentPrice-iBands(NULL, 0, iBands_Period, iBands_Deviation, 0, PRICE_CLOSE, Bands_Mode, CurrentBar);
if( value < 0 ) value = 0;
if( value > 0 ) value = 1;
SetIndexValue(CurrentBar, value);
value2=-(iBearsPower(NULL, 0, iPower_Period,Power_Price,CurrentBar)+iBullsPower(NULL, 0, iPower_Period,Power_Price,CurrentBar));
if( value2 < 0 ) value2 = 0;
if( value2 > 0 ) value2 = -1;
SetIndexValue2(CurrentBar, value2);
if( value == 1 ) GlobalVariableSet("MEDV",value);
if( value2 == -1 ) GlobalVariableSet("MEDV",value);
if( value2 == -1 && value == 1 ) GlobalVariableSet("MEDV",0);
//SetGlobalVariable("BUK",value);
}


  return(0);
}
Comments