Itend old_v1
Download script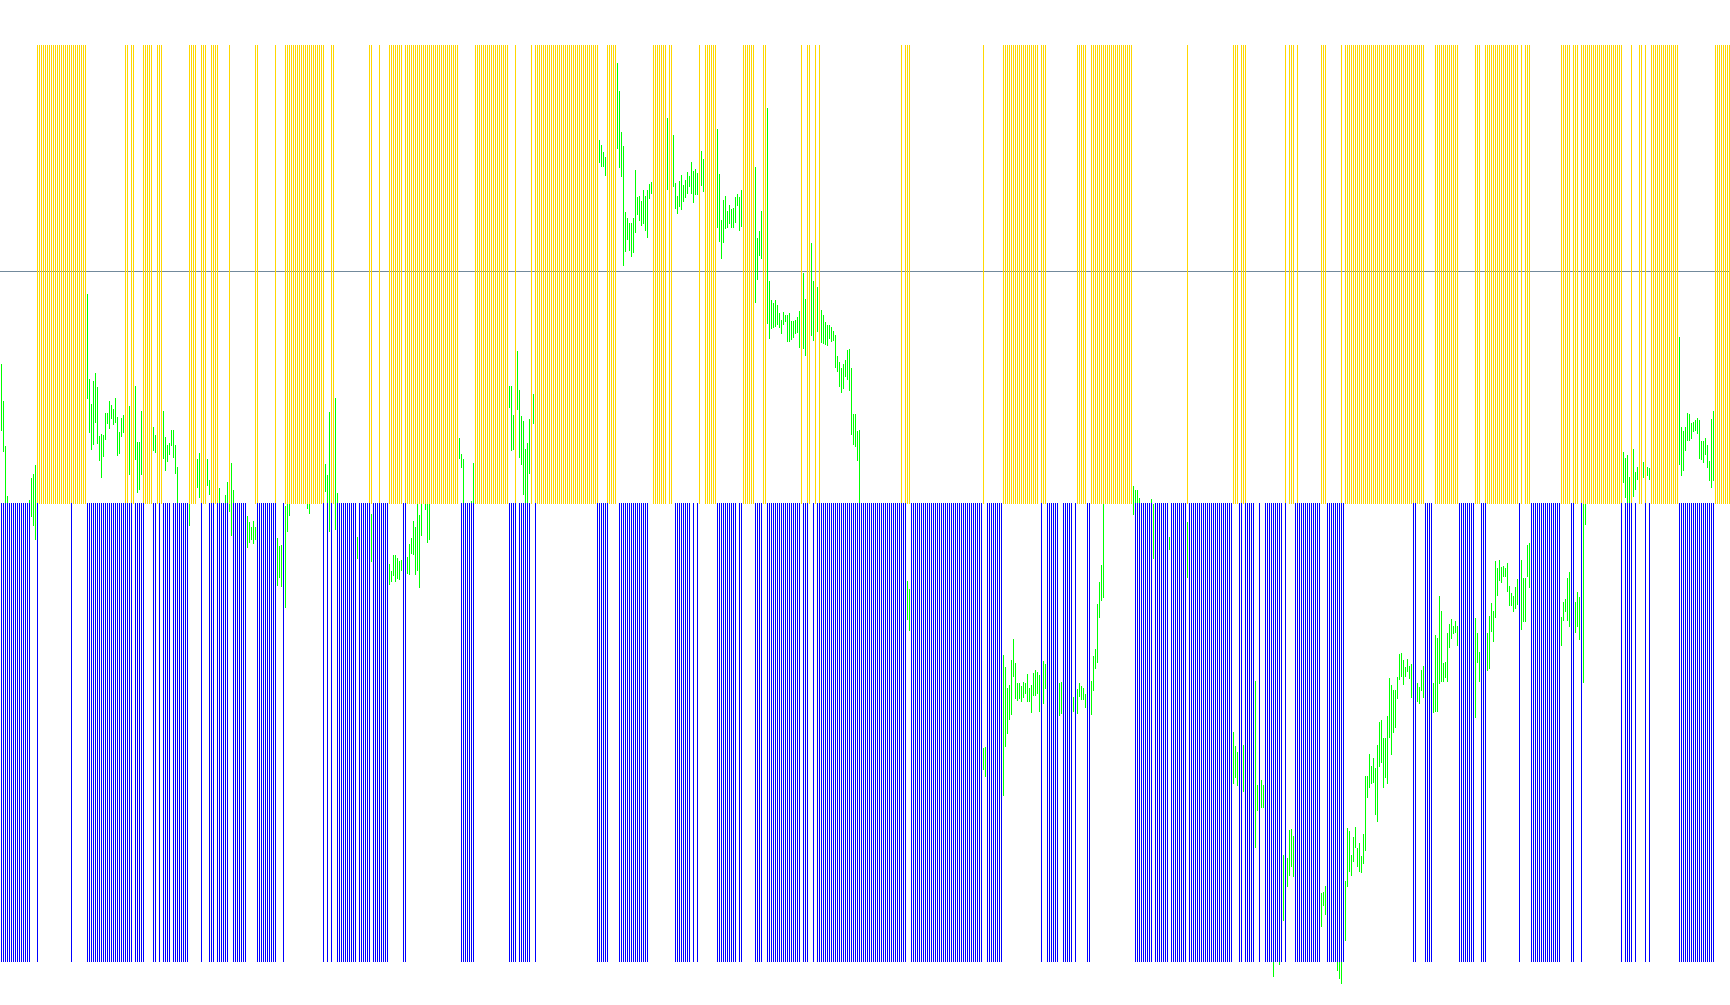
The iTrend script is a technical analysis tool designed to help traders visualize market momentum and trend direction by analyzing price movements relative to specific statistical boundaries. Unlike standard indicators that might simply show a moving average, this tool uses a dual-histogram approach in a separate window to provide a clearer picture of "buying" versus "selling" pressure.
How the Logic Works
The script functions by calculating two distinct types of data and displaying them as opposing histograms:
1. Trend Identification (Blue Histogram) The tool first looks at Bollinger Bands—a standard technical indicator that measures volatility. However, instead of just looking at the center line, this script examines the relationship between the current market price and the bands' high or low boundaries (depending on your settings).
- If the price sits above these calculated boundaries, the script recognizes bullish momentum and assigns a positive value.
- If the price is below, it acknowledges bearish pressure.
- The result is a visual representation of how much "room" the price has to move in a specific direction based on volatility limits.
2. Power Dynamics (Red Histogram) Simultaneously, the script calculates market "Power." It combines two different metrics—Bulls Power and Bears Power—to determine the underlying strength of the current trend over a specific period. By combining these, the tool can identify whether the aggressive side of the market (the buyers or the sellers) is dominating the price action.
Visual Interpretation
Because the logic produces two separate values:
- The Blue Histogram represents one perspective of the trend (Price vs. Volatility).
- The Red Histogram represents the opposite perspective (Market Power).
When these histograms move in harmony, they confirm the strength of the current trend. When they provide conflicting signals, it can alert a trader to potential exhaustion or a shift in momentum.
Key Customizations
The logic is highly flexible, allowing you to define exactly what "price" the script should watch. You can choose between standard closing prices or more specific data points like:
- Open/High/Low prices to capture different types of market activity.
- Median or Weighted prices for a smoothed look at market averages.
- Variable Periods to adjust how much historical data the script considers when making its calculations.
In essence, this tool acts as a "momentum thermometer," translating complex volatility and power calculations into a simple visual histogram that tells you who is currently winning the tug-of-war in the market.
/*-----------------------------+
|			       |
| Shared by www.Aptrafx.com    |
|			       |
+------------------------------*/

#include <stdlib.mqh>
//+------------------------------------------------------------------+
//|                                                       Itrend.mq4 |
//| TREND INDICATOR                                                  |
//|                                                                  |
//|                                        Converted by Mql2Mq4 v0.6 |
//|                                            http://yousky.free.fr |
//|                                    Copyright © 2006, Yousky Soft |
//+------------------------------------------------------------------+

#property copyright " Andrew "
#property link      " http://anri.aney.ru/forex/ "

#property indicator_separate_window
#property indicator_color1 Blue
#property indicator_buffers 2
#property indicator_color2 Red

//+------------------------------------------------------------------+
//| Common External variables                                        |
//+------------------------------------------------------------------+

//+------------------------------------------------------------------+
//| External variables                                               |
//+------------------------------------------------------------------+
extern double iBands_Mode_0_2 = 0;
extern double iPower_Price_0_6 = 0;
extern double iPrice_Type_0_3 = 0;
extern double iBands_Period = 20;
extern double iBands_Deviation = 2;
extern double iPower_Period = 14;

//+------------------------------------------------------------------+
//| Special Convertion Functions                                     |
//+------------------------------------------------------------------+

int LastTradeTime;
double ExtHistoBuffer[];
double ExtHistoBuffer2[];

void SetLoopCount(int loops)
{
}

void SetIndexValue(int shift, double value)
{
  ExtHistoBuffer[shift] = value;
}

void SetIndexValue2(int shift, double value)
{
  ExtHistoBuffer2[shift] = value;
}

//+------------------------------------------------------------------+
//| End                                                              |
//+------------------------------------------------------------------+

//+------------------------------------------------------------------+
//| Initialization                                                   |
//+------------------------------------------------------------------+

int init()
{
   SetIndexStyle(0, DRAW_HISTOGRAM, STYLE_SOLID);
   SetIndexBuffer(0, ExtHistoBuffer);
   SetIndexStyle(1, DRAW_HISTOGRAM, STYLE_SOLID);
   SetIndexBuffer(1, ExtHistoBuffer2);
   return(0);
}
int start()
{
//+------------------------------------------------------------------+
//| Local variables                                                  |
//+------------------------------------------------------------------+
double value = 0;
double value2 = 0;
int CurrentBar = 0;
double Bands_Mode = 0;
double Power_Price = 0;
double CurrentPrice = 0;

/*[[
Name := iTrend 1.01
Author := Andrew
Link := http://anri.aney.ru/forex/
Notes := TREND INDICATOR
Separate Window := YES
First Color := blue
First Draw Type := histogram
First Symbol := 217
Use Second Data := Yes
Second Color := red
Second Draw Type := histogram
Second Symbol := 218
]]*/
 // =0-2 MODE_MAIN, MODE_LOW, MODE_HIGH
 // =0-6 PRICE_CLOSE,PRICE_OPEN,PRICE_HIGH,PRICE_LOW,PRICE_MEDIAN,PRICE_TYPICAL,PRICE_WEIGHTED
 // =0-3 PRICE_CLOSE,PRICE_OPEN,PRICE_HIGH,PRICE_LOW
//20

//13


SetLoopCount(0);
if( iBands_Mode_0_2 == 1 ) Bands_Mode=MODE_LOW
; else if( iBands_Mode_0_2 == 2 ) Bands_Mode=MODE_HIGH
; else Bands_Mode=MODE_MAIN;

if( iPower_Price_0_6 == 1 ) Power_Price=PRICE_OPEN
; else if( iPower_Price_0_6 == 2 ) Power_Price=PRICE_HIGH
; else if( iPower_Price_0_6 == 3 ) Power_Price=PRICE_LOW
; else if( iPower_Price_0_6 == 4 ) Power_Price=PRICE_MEDIAN
; else if( iPower_Price_0_6 == 5 ) Power_Price=PRICE_TYPICAL
; else if( iPower_Price_0_6 == 6 ) Power_Price=PRICE_WEIGHTED
; else Power_Price=PRICE_CLOSE;

for(CurrentBar=Bars+1;CurrentBar>=0 ;CurrentBar--){
if( iPrice_Type_0_3 == 1 ) CurrentPrice=Open[CurrentBar]
; else if( iPrice_Type_0_3 == 2 ) CurrentPrice=High[CurrentBar]
; else if( iPrice_Type_0_3 == 3 ) CurrentPrice=Low[CurrentBar]
; else CurrentPrice=Close[CurrentBar];
value=CurrentPrice-iBands(NULL, 0, iBands_Period, iBands_Deviation, 0, PRICE_CLOSE, Bands_Mode, CurrentBar);
if( value < 0 ) value = 0;
if( value > 0 ) value = 1;
SetIndexValue(CurrentBar, value);
value2=-(iBearsPower(NULL, 0, iPower_Period,Power_Price,CurrentBar)+iBullsPower(NULL, 0, iPower_Period,Power_Price,CurrentBar));
if( value2 < 0 ) value2 = 0;
if( value2 > 0 ) value2 = -1;
SetIndexValue2(CurrentBar, value2);
if( value == 1 ) GlobalVariableSet("MEDV",value);
if( value2 == -1 ) GlobalVariableSet("MEDV",value);
if( value2 == -1 && value == 1 ) GlobalVariableSet("MEDV",0);
//SetGlobalVariable("BUK",value);
}


  return(0);
}
Comments