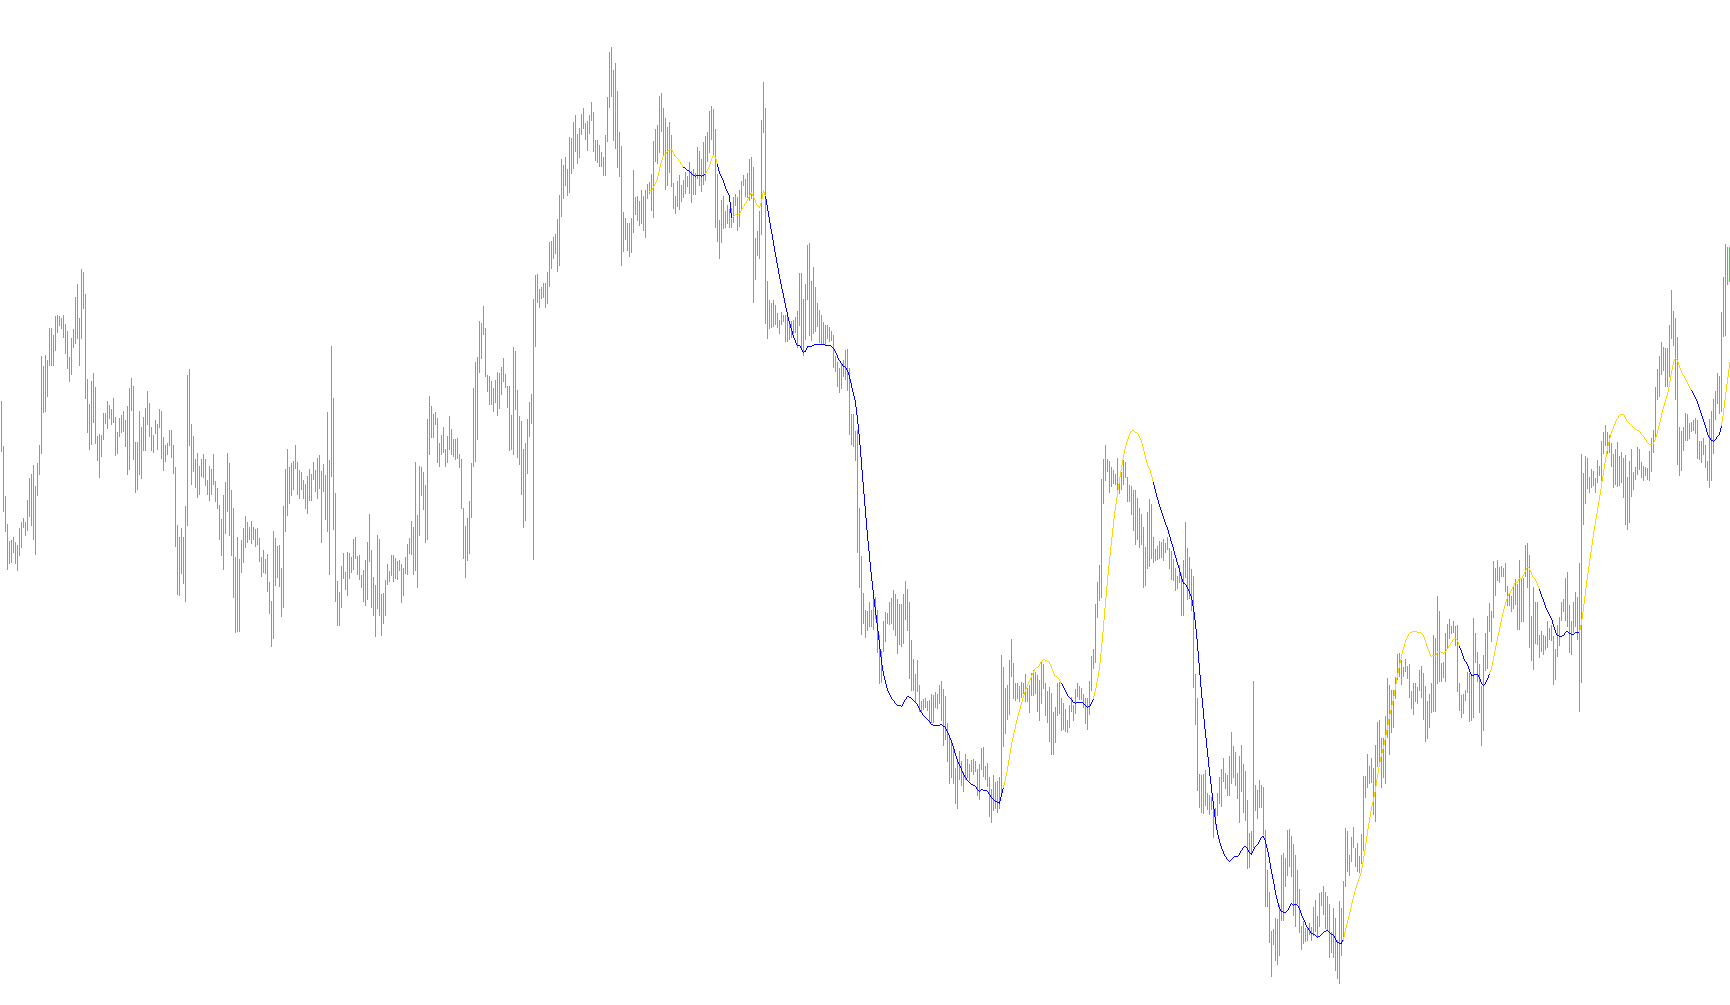
This tool is designed as a sophisticated visual indicator for trading platforms, utilizing a mathematical concept known as a Kalman filter to smooth out market price action. Its primary goal is to help traders distinguish between "noise"—the random, minor fluctuations in price—and the actual underlying trend of an asset.
Core Functionality
The script processes historical price data to generate two distinct visual lines on your chart. These lines act as dynamic trackers that follow the market's momentum while remaining smoother than raw price movements. By filtering out unnecessary volatility, the tool aims to provide a clearer picture of where the price is heading.
Key Components of the Logic:
- Flexible Price Input: The script is highly customizable regarding which data points it monitors. It can calculate its logic based on various types of market prices, including standard Closing prices, Opening prices, Highs, Lows, or custom averages (such as the median or weighted price).
- Dynamic Tracking (Velocity and Error): Rather than simply averaging past prices, the logic calculates "Velocity" and "Error." This means the indicator looks at how fast the price is moving in a specific direction and adjusts its position accordingly. It attempts to correct for deviations from the trend, allowing the lines to react intelligently to new information without being overly jumpy.
- Sensitivity Controls: Users can fine-tune the responsiveness of the filter through two main parameters:
- K-Factor: Adjusts the weight given to current movements.
- Sharpness: Determines how aggressively the indicator reacts to changes, allowing the user to choose between a very smooth, "lazy" line or a more reactive, "sharp" line.
- Trend Visualization: The tool automatically handles the visual distinction of direction. It uses two separate buffers (represented by different colors) to highlight upward and downward movements. This makes it easy for a trader to see at a glance whether the filtered momentum is currently bullish or bearish.
How it Benefits the User
By using this Kalman filter logic, traders can avoid making decisions based on temporary price spikes that don't represent a real change in market direction. It provides a stabilized "path" for the price, helping to identify sustained trends more reliably than standard moving averages might achieve.
/*-----------------------------+
|			       |
| Shared by www.Aptrafx.com    |
|			       |
+------------------------------*/

//+------------------------------------------------------------------+
//|                                                Kalman filter.mq4 |
//|                              Copyright © 2006, iziogas@mail.com. |
//+------------------------------------------------------------------+
#property copyright "iziogas@mail.com"

#property indicator_chart_window
#property indicator_buffers 2
#property indicator_color1 Turquoise
#property indicator_color2 Orange
//---- indicator parameters
//Mode description
// 0: Close
// 1: Open
// 2: High
// 3: Low
// 4: Median   (H+L/2)
// 5: Typical  (H+L+C/3)
// 6: Weighted (H+L+C+C/4)
extern int Mode=6;
extern double K=1;
extern double Sharpness=1;
extern int    draw_begin=500;

//---- indicator buffers
double ExtMapBufferUp[];
double ExtMapBufferDown[];

//----
int ExtCountedBars=0;
//+------------------------------------------------------------------+
//| Custom indicator initialization function                         |
//+------------------------------------------------------------------+
int init()
  {
//---- drawing settings
   SetIndexStyle(0,DRAW_LINE);
   SetIndexStyle(1,DRAW_LINE);
   IndicatorDigits(MarketInfo(Symbol(),MODE_DIGITS));

   SetIndexDrawBegin(0,draw_begin);
   SetIndexDrawBegin(1,draw_begin);

//---- indicator buffers mapping
   SetIndexBuffer(0,ExtMapBufferUp);
   SetIndexBuffer(1,ExtMapBufferDown);

//---- initialization done
   return(0);
  }

//+------------------------------------------------------------------+
//|                                                                  |
//+------------------------------------------------------------------+
double iValue(int mode, int shift){
   switch (mode) {
      case 0:
         return (iClose(NULL,0,shift));
      case 1:
         return (iOpen(NULL,0,shift));
      case 2:
         return (iHigh(NULL,0,shift));
      case 3:
         return (iLow(NULL,0,shift));
      case 4:
         return ((iHigh(NULL,0,shift)+iLow(NULL,0,shift))/2);
      case 5:
         return ((iHigh(NULL,0,shift)+iLow(NULL,0,shift)+iClose(NULL,0,shift))/3);
      case 6:
         return ((iHigh(NULL,0,shift)+iLow(NULL,0,shift)+iClose(NULL,0,shift)+iClose(NULL,0,shift))/4);
      default:
         return (0);
      }
}

//+------------------------------------------------------------------+
//|                                                                  |
//+------------------------------------------------------------------+
int start()
  {
   if(Bars<=draw_begin) return(0);


   int i;


   double Velocity=0;
   double Distance=0;
   double Error=0;
   double value = iValue(Mode,draw_begin+1);

   for(i=draw_begin;i>=0;i--) {

      Distance = iValue(Mode,i) - value;
      Error = value + Distance * MathSqrt(Sharpness*K/100);
      Velocity = Velocity + Distance*K/100;
      value = Error+Velocity;

      //color lines
      if (Velocity>0) {
         ExtMapBufferUp[i] = value;
         //ExtMapBufferUp[i] = S;
         ExtMapBufferDown[i] = EMPTY_VALUE;

         if (ExtMapBufferUp[i+1] == EMPTY_VALUE) ExtMapBufferUp[i+1] = ExtMapBufferDown[i+1];
      } else {
         ExtMapBufferUp[i] = EMPTY_VALUE;
         ExtMapBufferDown[i] = value;
         //ExtMapBufferDown[i] = S;

         if (ExtMapBufferDown[i+1] == EMPTY_VALUE) ExtMapBufferDown[i+1] = ExtMapBufferUp[i+1];
      }

   }
//---- done
   return(0);
  }
Comments