Keltner Channel
Download script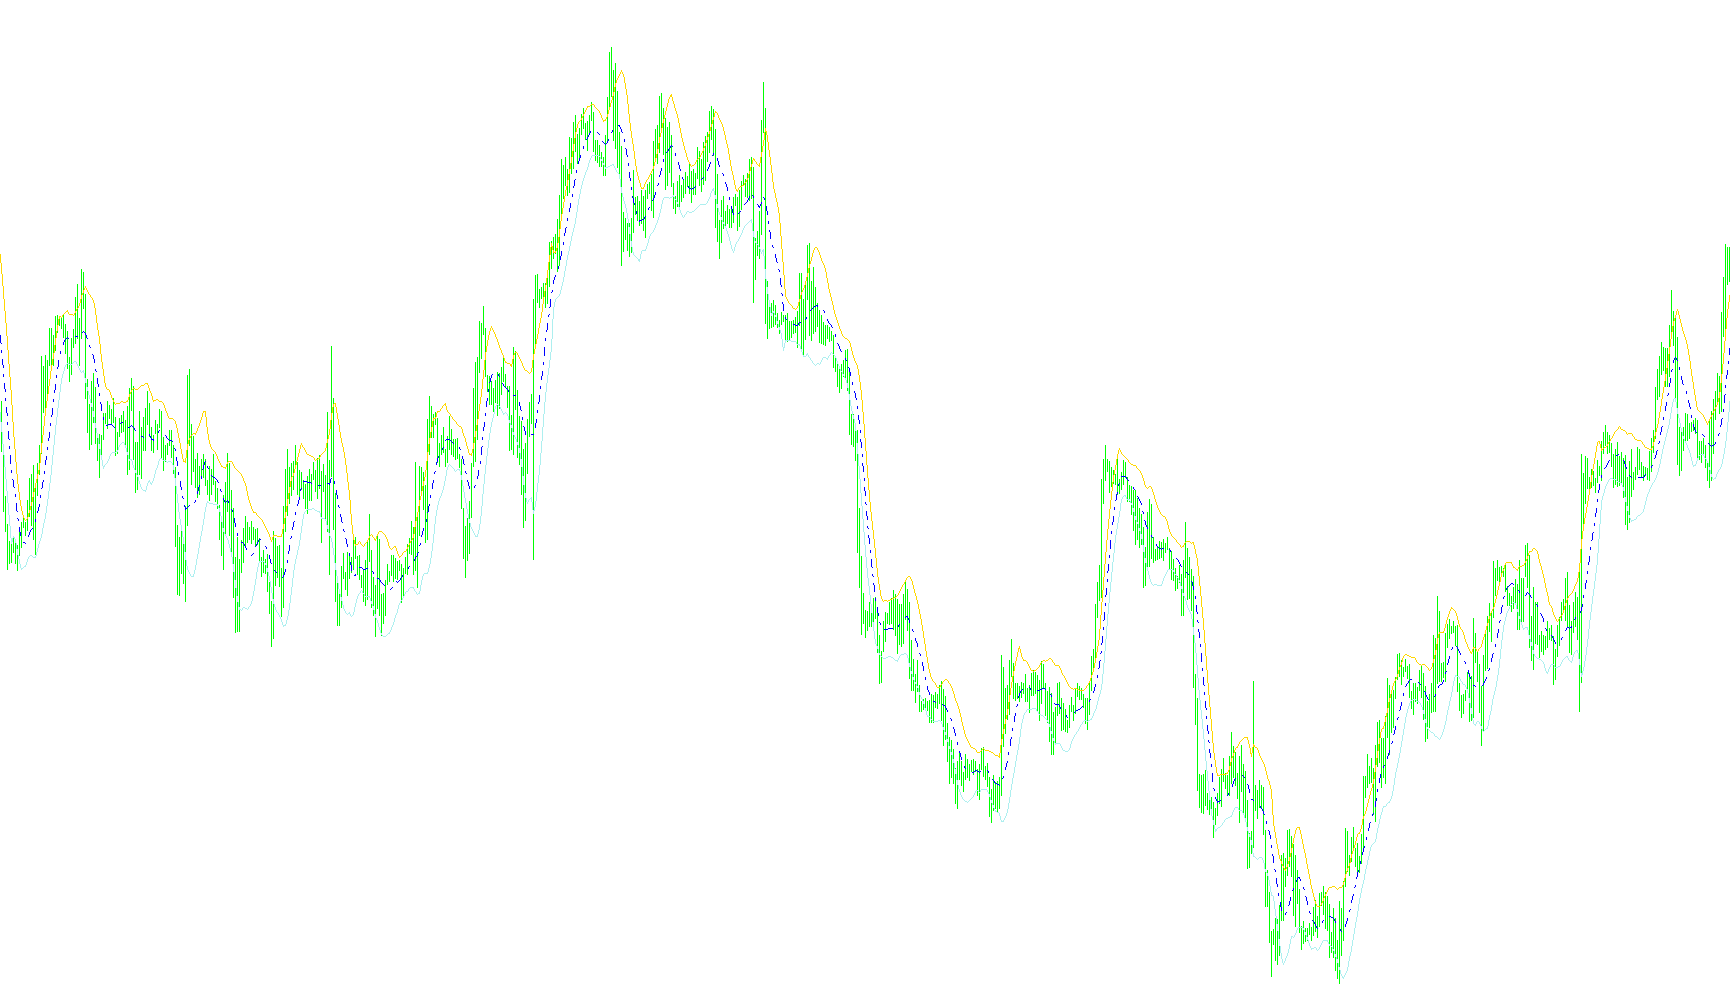
This script is designed to create a visual tool called the Keltner Channel on your trading charts. Its primary purpose is to help traders visualize market volatility and identify whether the current price action is behaving normally or moving into an extreme range.
How the Logic Works
The indicator works by calculating three distinct lines that form a "channel" around the current price:
1. The Center Line (Middle) The script first establishes a baseline for the price. It calculates a Simple Moving Average (SMA) based on a specific number of previous bars (the "period"). This represents the "average" price over that timeframe, acting as the equilibrium point of the market.
2. The Volatility Measurement To determine how wide the channel should be, the script looks at the "range" of the price. It specifically measures the distance between the highest price (High) and the lowest price (Low) for each candle over the chosen period. By averaging these distances, it determines how much the market is swinging at any given moment.
3. The Upper and Lower Boundaries Finally, the script combines the Center Line and the Volatility Measurement to draw the outer edges of the channel:
- Upper Boundary: The script adds the volatility measurement to the Center Line.
- Lower Boundary: The script subtracts the volatility measurement from the Center Line.
Visual Output
When you apply this to your chart, you will see a central dashed line representing the average price, with two solid outer lines forming a corridor.
- Tight Channels: When the market is calm and movingsideways, these lines will move closer together.
- Wide Channels: During periods of high activity or aggressive price swings, the channel will expand automatically to accommodate the increased volatility.
By using this tool, traders can visually assess whether the price is "breaking out" beyond normal historical volatility or if it is staying contained within a standard trading range.
//+------------------------------------------------------------------+
//|                                              Keltner Channel.mq4 |
//|                                                  Coded by Gilani |
//|                      Copyright © 2005, MetaQuotes Software Corp. |
//|                                        http://www.metaquotes.net |
//+------------------------------------------------------------------+
#property copyright "Copyright © 2005, MetaQuotes Software Corp."
#property link      "http://www.metaquotes.net"

#property indicator_chart_window
#property indicator_buffers 3
#property indicator_color1 Red
#property indicator_color2 Blue
#property indicator_color3 Red
//---- input parameters
extern int period = 10;
//----
double upper[], middle[], lower[];

//+------------------------------------------------------------------+
//| Custom indicator initialization function                         |
//+------------------------------------------------------------------+
int init()
  {
   SetIndexBuffer(0, upper);
   SetIndexStyle(0, DRAW_LINE);
   SetIndexShift(0, 0);
   SetIndexDrawBegin(0, 0);
//----
   SetIndexBuffer(1, middle);
   SetIndexStyle(1, DRAW_LINE, STYLE_DASHDOT);
   SetIndexShift(1, 0);
   SetIndexDrawBegin(1, 0);
//----
   SetIndexBuffer(2, lower);
   SetIndexStyle(2, DRAW_LINE);
   SetIndexShift(2, 0);
   SetIndexDrawBegin(2, 0);
//---- name for DataWindow label
   SetIndexLabel(0, "KChanUp(" + period + ")");
   SetIndexLabel(1, "KChanMid(" + period + ")");
   SetIndexLabel(2, "KChanLow(" + period + ")");
//----
   return(0);
  }
//+------------------------------------------------------------------+
//| Custor indicator deinitialization function                       |
//+------------------------------------------------------------------+
int deinit()
  {
//----
   return(0);
  }
//+------------------------------------------------------------------+
//| Custom indicator iteration function                              |
//+------------------------------------------------------------------+
int start()
  {
   int limit;
   double avg;
   int counted_bars = IndicatorCounted();
   if(counted_bars < 0)
       return(-1);
   if(counted_bars > 0)
       counted_bars--;
   limit = Bars - counted_bars;
//----
   for(int x = 0; x < limit; x++)
     {
      middle[x] = iMA(NULL, 0, period, 0, MODE_SMA, PRICE_TYPICAL, x);
      avg = findAvg(period, x);
      upper[x] = middle[x] + avg;
      lower[x] = middle[x] - avg;
     }
   return(0);
  }
//+------------------------------------------------------------------+
//|                                                                  |
//+------------------------------------------------------------------+
double findAvg(int period, int shift)
  {
   double sum = 0;
   for(int x = shift; x < (shift + period); x++)
     {
       sum += High[x] - Low[x];
     }
   sum = sum / period;
   return(sum);
  }
//+------------------------------------------------------------------+
Comments