Keltner_Channel
Download script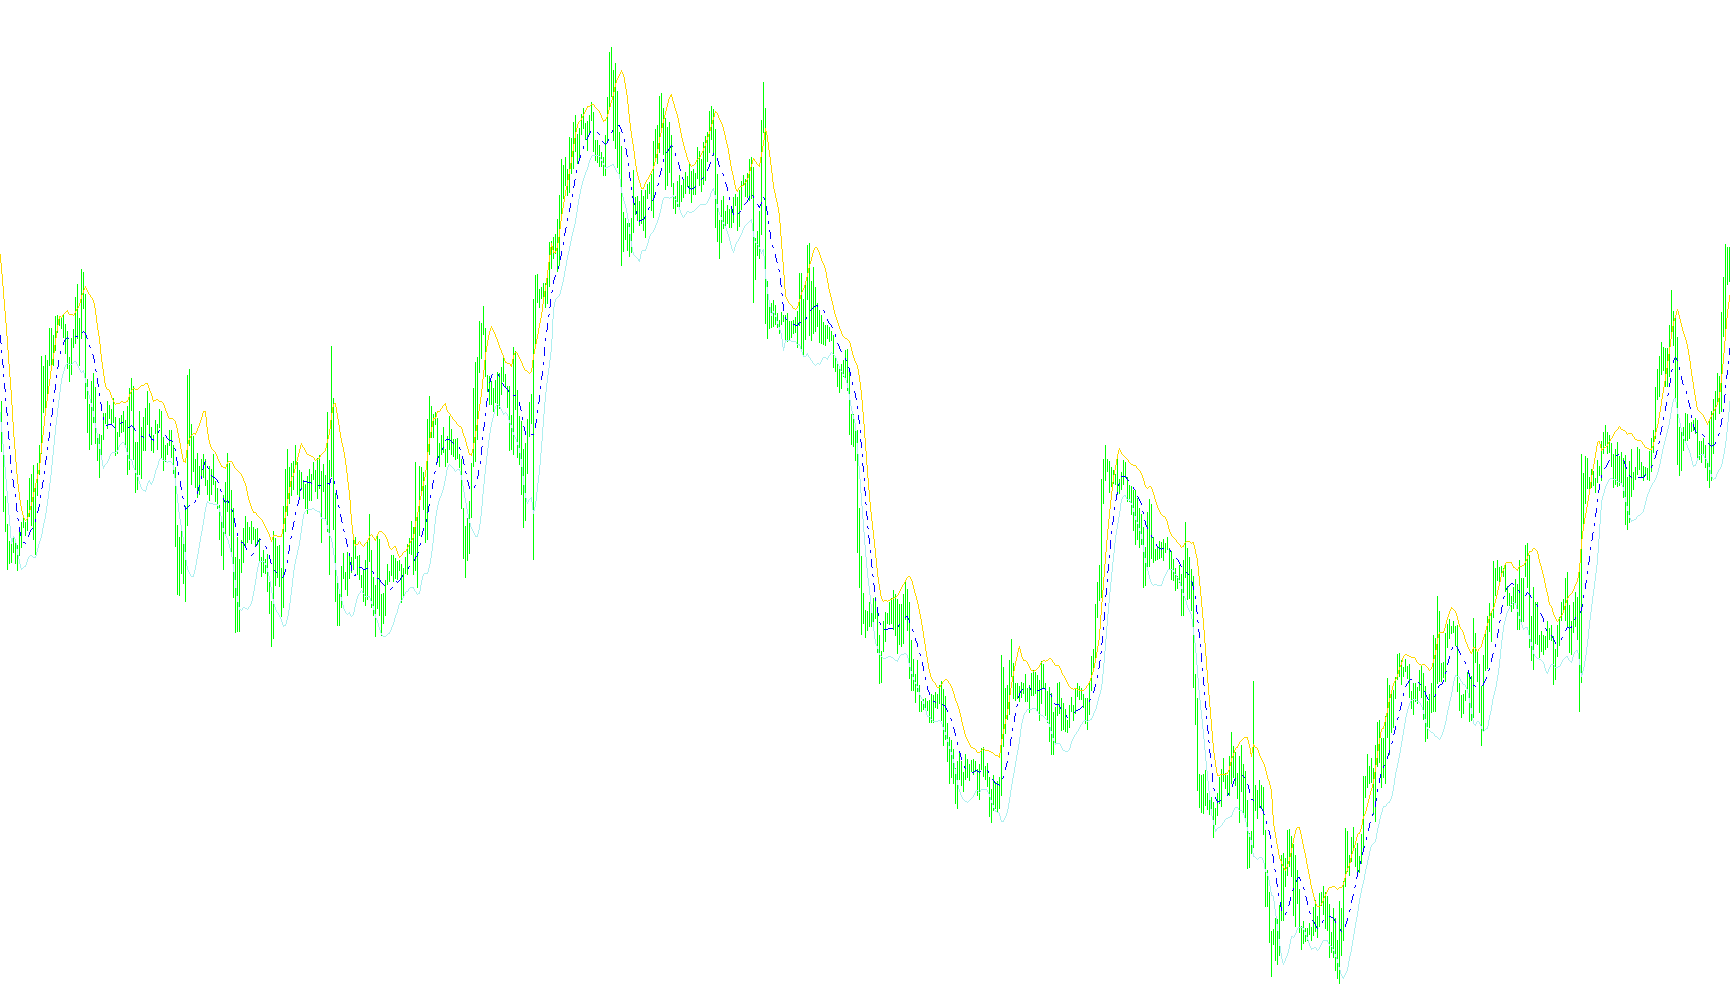
This script is designed to create a visual tool called a Keltner Channel on your trading charts. It helps traders understand the current "normal" range of price movement by drawing three distinct lines that form a band around the market activity.
How it Works
The indicator works by calculating a central path and then determining how much the price typically fluctuates around that path. It breaks down into three main components:
-
The Middle Line (The Baseline): The script first calculates a moving average based on a set timeframe (which you can adjust). This represents the "average" price over a specific period. In the visual output, this is shown as a dashed line, acting as the equilibrium point for the market.
-
The Volatility Measurement: To determine how wide the channel should be, the script looks at the "range" of each individual candle (the distance between the highest and lowest price reached during that period). It averages these ranges over your chosen timeframe to gauge how much the market is currently swinging.
-
The Upper and Lower Boundaries: Finally, the script takes that volatility measurement and adds it to the Middle Line to create the Upper Boundary, then subtracts it from the Middle Line to create the Lower Boundary.
What this means for your trading
Together, these three lines form a "channel."
- When the price stays within the red upper and lower boundaries, it is considered to be moving within its normal expected range.
- The width of the channel expands automatically when the market becomes more volatile (bigger swings) and tightens when the market becomes calm.
By using this tool, you can visually identify when price movements might be overextended or when the market is returning to its average trend.
//+------------------------------------------------------------------+
//|                                              Keltner Channel.mq4 |
//|                      Copyright © 2005, MetaQuotes Software Corp. |
//|                                                                  |
//+------------------------------------------------------------------+
#property copyright "Copyright © 2005, MetaQuotes Software Corp."

#property indicator_chart_window
#property indicator_buffers 3
#property indicator_color1 Red
#property indicator_color2 Blue
#property indicator_color3 Red
//---- input parameters
extern int period = 10;
//----
double upper[], middle[], lower[];

//+------------------------------------------------------------------+
//| Custom indicator initialization function                         |
//+------------------------------------------------------------------+
int init()
  {
   SetIndexBuffer(0, upper);
   SetIndexStyle(0, DRAW_LINE);
   SetIndexShift(0, 0);
   SetIndexDrawBegin(0, 0);
//----
   SetIndexBuffer(1, middle);
   SetIndexStyle(1, DRAW_LINE, STYLE_DASHDOT);
   SetIndexShift(1, 0);
   SetIndexDrawBegin(1, 0);
//----
   SetIndexBuffer(2, lower);
   SetIndexStyle(2, DRAW_LINE);
   SetIndexShift(2, 0);
   SetIndexDrawBegin(2, 0);
//---- name for DataWindow label
   SetIndexLabel(0, "KChanUp(" + period + ")");
   SetIndexLabel(1, "KChanMid(" + period + ")");
   SetIndexLabel(2, "KChanLow(" + period + ")");
//----
   return(0);
  }
//+------------------------------------------------------------------+
//| Custor indicator deinitialization function                       |
//+------------------------------------------------------------------+
int deinit()
  {
//----
   return(0);
  }
//+------------------------------------------------------------------+
//| Custom indicator iteration function                              |
//+------------------------------------------------------------------+
int start()
  {
   int limit;
   double avg;
   int counted_bars = IndicatorCounted();
   if(counted_bars < 0)
       return(-1);
   if(counted_bars > 0)
       counted_bars--;
   limit = Bars - counted_bars;
//----
   for(int x = 0; x < limit; x++)
     {
      middle[x] = iMA(NULL, 0, period, 0, MODE_SMA, PRICE_TYPICAL, x);
      avg = findAvg(period, x);
      upper[x] = middle[x] + avg;
      lower[x] = middle[x] - avg;
     }
   return(0);
  }
//+------------------------------------------------------------------+
//|                                                                  |
//+------------------------------------------------------------------+
double findAvg(int period, int shift)
  {
   double sum = 0;
   for(int x = shift; x < (shift + period); x++)
     {
       sum += High[x] - Low[x];
     }
   sum = sum / period;
   return(sum);
  }
//+------------------------------------------------------------------+
Comments