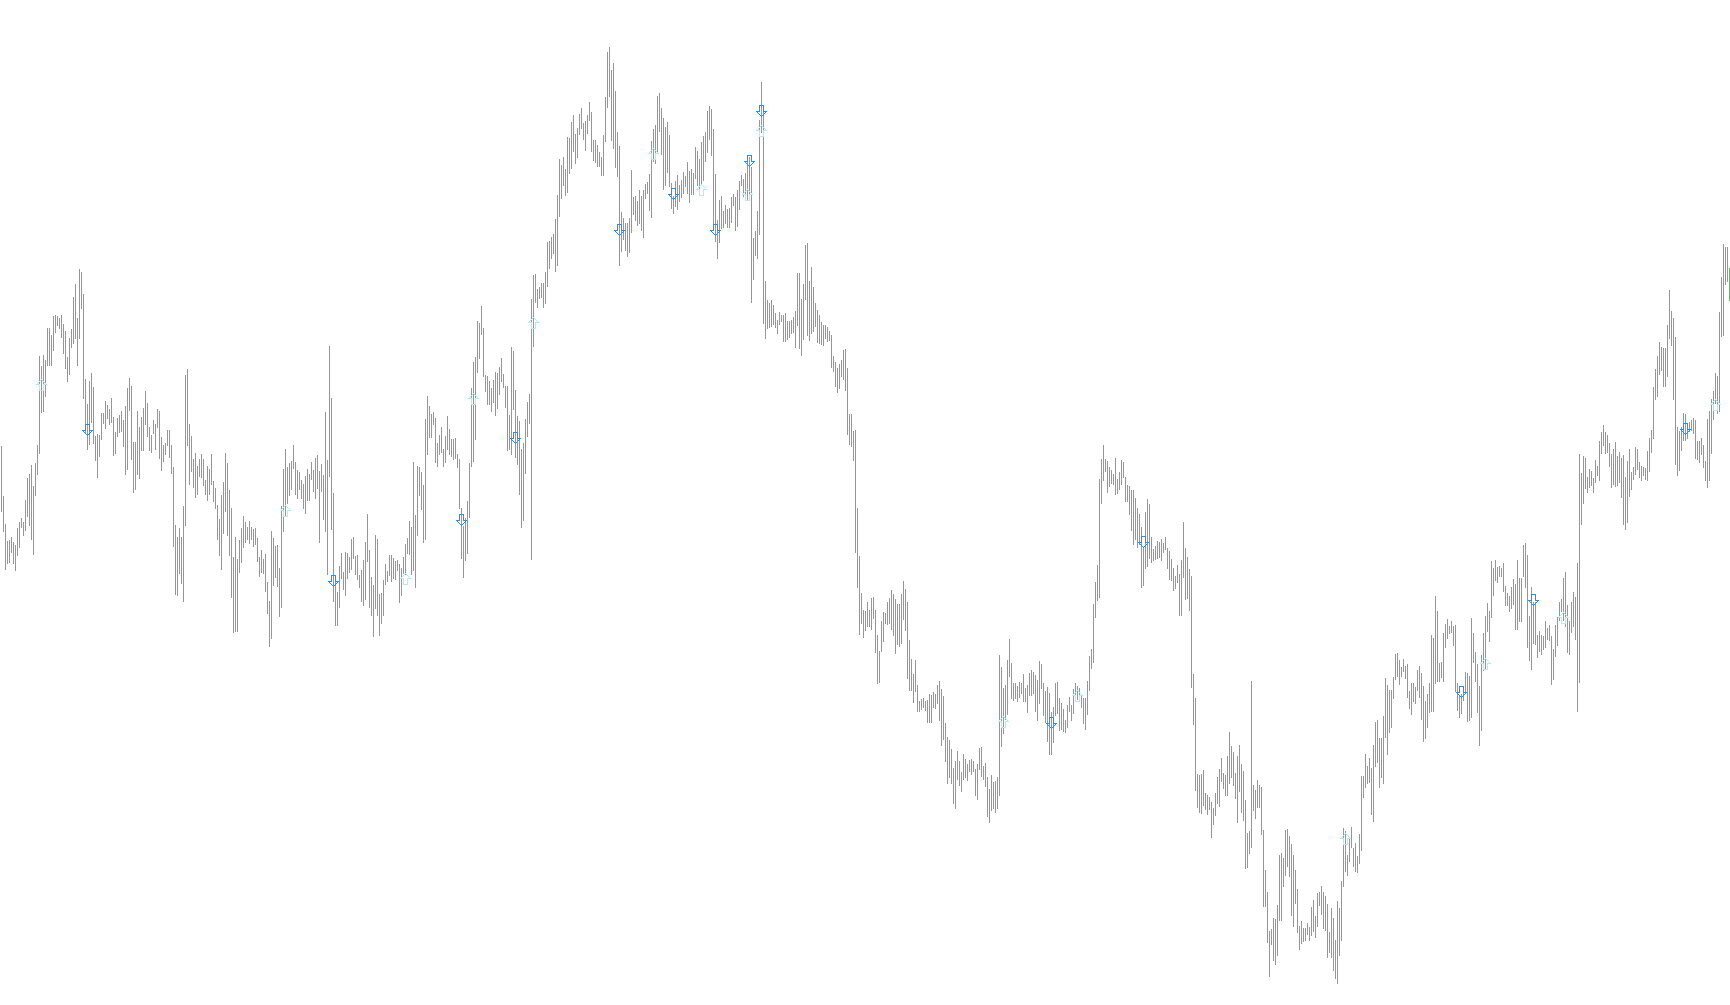
This technical script is designed to provide visual trading signals by analyzing price momentum across two different timeframes simultaneously. It specifically focuses on identifying "cross-over" moments where the market sentiment shifts from bearish to bullish, or vice versa.
Core Logic and Methodology
The tool operates using a layered calculation system involving Moving Averages (MA). Instead of just looking at price directly, it calculates a "Histogram" value—which represents the distance between two fast-moving averages. It then applies a third moving average to that histogram to smooth out the data, helping to filter out market noise and identify significant trend reversals.
Multi-Timeframe Analysis
One of the primary strengths of this logic is its ability to "look ahead" at higher timeframes while you are viewing lower ones.
- Higher Timeframe (H1): The script constantly monitors the 1-hour timeframe. It identifies specific points where the smoothed momentum indicator crosses from negative to positive (or vice versa). When these signals occur, it marks them as potential "anchor" points.
- Current Timeframe (M30): The script then projects these high-level insights onto your active chart (e.g., the 30-minute timeframe). It looks for confirmation between the current market activity and the higher timeframe's signals.
Signal Generation
The script translates these mathematical calculations into visual arrows on your chart to assist in making trading decisions:
- Bullish Signals (Upward Arrows): These appear when the momentum on the higher timeframe turns positive, and the script confirms that the current price action aligns with an upward trend. It places an arrow slightly below the price candle to indicate a potential buying opportunity.
- Bearish Signals (Downward Arrows): These appear when the momentum on the higher timeframe turns negative, confirming a downward shift in sentiment. It places an arrow slightly above the price candle to indicate a potential selling opportunity.
Summary for the Trader
Essentially, this script acts as a filter. Rather than giving you a signal every time the price moves slightly, it waits for a specific mathematical confirmation on a larger scale (the 1-hour chart) before telling you whether the current smaller-scale movement is worth following. It aims to provide a clearer picture of the market's direction by combining momentum analysis with multi-timeframe synchronization.
/*-----------------------------+
|			       |
| Shared by www.Aptrafx.com    |
|			       |
+------------------------------*/


//+------------------------------------------------------------------+
//|                                                KI_signals_v1.mq4 |
//|                                                          Kalenzo |
//|                                      bartlomiej.gorski@gmail.com |
//+------------------------------------------------------------------+
#property copyright "Kalenzo"
#property link      "bartlomiej.gorski@gmail.com"

#property indicator_chart_window
#property indicator_buffers 8
#property indicator_color1 AliceBlue
#property indicator_color2 AliceBlue
#property indicator_color3 DarkViolet
#property indicator_color4 DarkViolet

#property indicator_level1 0

extern int Length1 = 3;
extern int Length2 = 10;
extern int Length3 = 18;


// 60[min] = PERIOD_H1
int period = 60;


double Histo[];
double MaHisto[];

double Histoh1[];
double MaHistoh1[];

double up[];
double dn[];

double uph1[];
double dnh1[];


//+------------------------------------------------------------------+
//| Custom indicator initialization function                         |
//+------------------------------------------------------------------+
int init()
{
//---- additional buffers are used for counting
   IndicatorBuffers(8);

   SetIndexStyle(0,DRAW_ARROW,EMPTY,1);
   SetIndexStyle(1,DRAW_ARROW,EMPTY,1);

   SetIndexStyle(2,DRAW_ARROW,EMPTY,1);
   SetIndexStyle(3,DRAW_ARROW,EMPTY,1);

   SetIndexArrow(0,241);
   SetIndexArrow(1,242);

   SetIndexArrow(2,241);
   SetIndexArrow(3,242);

//   IndicatorDigits(6);

   SetIndexBuffer(0,up);
   SetIndexBuffer(1,dn);

   SetIndexBuffer(2,uph1);
   SetIndexBuffer(3,dnh1);

   SetIndexBuffer(4,Histoh1);
   SetIndexBuffer(5,MaHistoh1);
   SetIndexBuffer(6,Histo);
   SetIndexBuffer(7,MaHisto);

//   IndicatorShortName("KI signals v1");


   return(0);
}


int start()
  {
   int limit;
   int counted_bars;// = IndicatorCounted();

   int tmp, i, j, m;


   // this is fro M30 (we are on it), but we want for H1
   counted_bars = IndicatorCounted();
   if(counted_bars<0) counted_bars=0;
   if(counted_bars>0) counted_bars--;

  // ----------- H1

   // this is for H1, but counted_bars is for M30
   // so...
   limit = (Bars-counted_bars)/(period/Period()) + 1;
//   limit=iBars(Symbol(),period)-1;//counted_bars;

   for (i = 0 ;i <= limit ;i++)Histoh1[i] = iMA(Symbol(),period,Length1,0,MODE_EMA,PRICE_CLOSE,i) - iMA(Symbol(),period,Length2,0,MODE_EMA,PRICE_CLOSE,i);
   for (j = 0 ;j <= limit ;j++)MaHistoh1[j] = iMAOnArray(Histoh1,0,Length3,0,MODE_EMA,j);
   for (m = 0 ;m <= limit ;m++)
   {
      if(MaHistoh1[m+1] <= 0 && MaHistoh1[m]>0)
      {
         tmp = iTime (Symbol(),period,m);
         for (j = 0; j < Bars; j++)
         {
           if (iTime(Symbol(),0,j) == tmp)
            uph1[j-period/Period()+1] = iOpen(Symbol(),period,m)-(20*Point);
         }
      }

      if(MaHistoh1[m+1] >= 0 && MaHistoh1[m]<0)
      {
         tmp = iTime (Symbol(),period,m);
         for (j = 0; j < Bars; j++)
         {
           if (iTime(Symbol(),0,j) == tmp)
            dnh1[j-period/Period()+1] = iOpen(Symbol(),period,m)+(20*Point);
         }
      }
   }


  // ----------- M30


  counted_bars = IndicatorCounted();

  if(counted_bars<0) counted_bars=0;
  if(counted_bars>0) counted_bars--;

  limit=Bars-counted_bars;

   for (i = 0 ;i <= limit ;i++)Histo[i] = iMA(Symbol(),0,Length1,0,MODE_EMA,PRICE_CLOSE,i) - iMA(Symbol(),0,Length2,0,MODE_EMA,PRICE_CLOSE,i);
   for (j = 0 ;j <= limit ;j++)MaHisto[j] = iMAOnArray(Histo,0,Length3,0,MODE_EMA,j);
   for (m = 0 ;m <= limit ;m++)
   {
      if(MaHisto[m+1] <= 0 && MaHisto[m]>0)
      {
        for (i = m+1; i < limit; i++)
        {
          if (uph1[i] != dnh1[i])
          {
            if (uph1[i] < dnh1[i])
              up[m] = iOpen(Symbol(),0,m)-(20*Point);
            else
              break;
          }
        }
      }
      if(MaHisto[m+1] >= 0 && MaHisto[m]<0)
      {
        for (i = m+1; i < limit; i++)
        {
          if (uph1[i] != dnh1[i])
          {
            if (uph1[i] > dnh1[i])
              dn[m] = iOpen(Symbol(),0,m)+(20*Point);
            else
              break;
          }
        }
      }
   }


  return(0);
}
//+------------------------------------------------------------------+
Comments