KI_signals1_H1+low_3-10-18_optimized_v1
Download script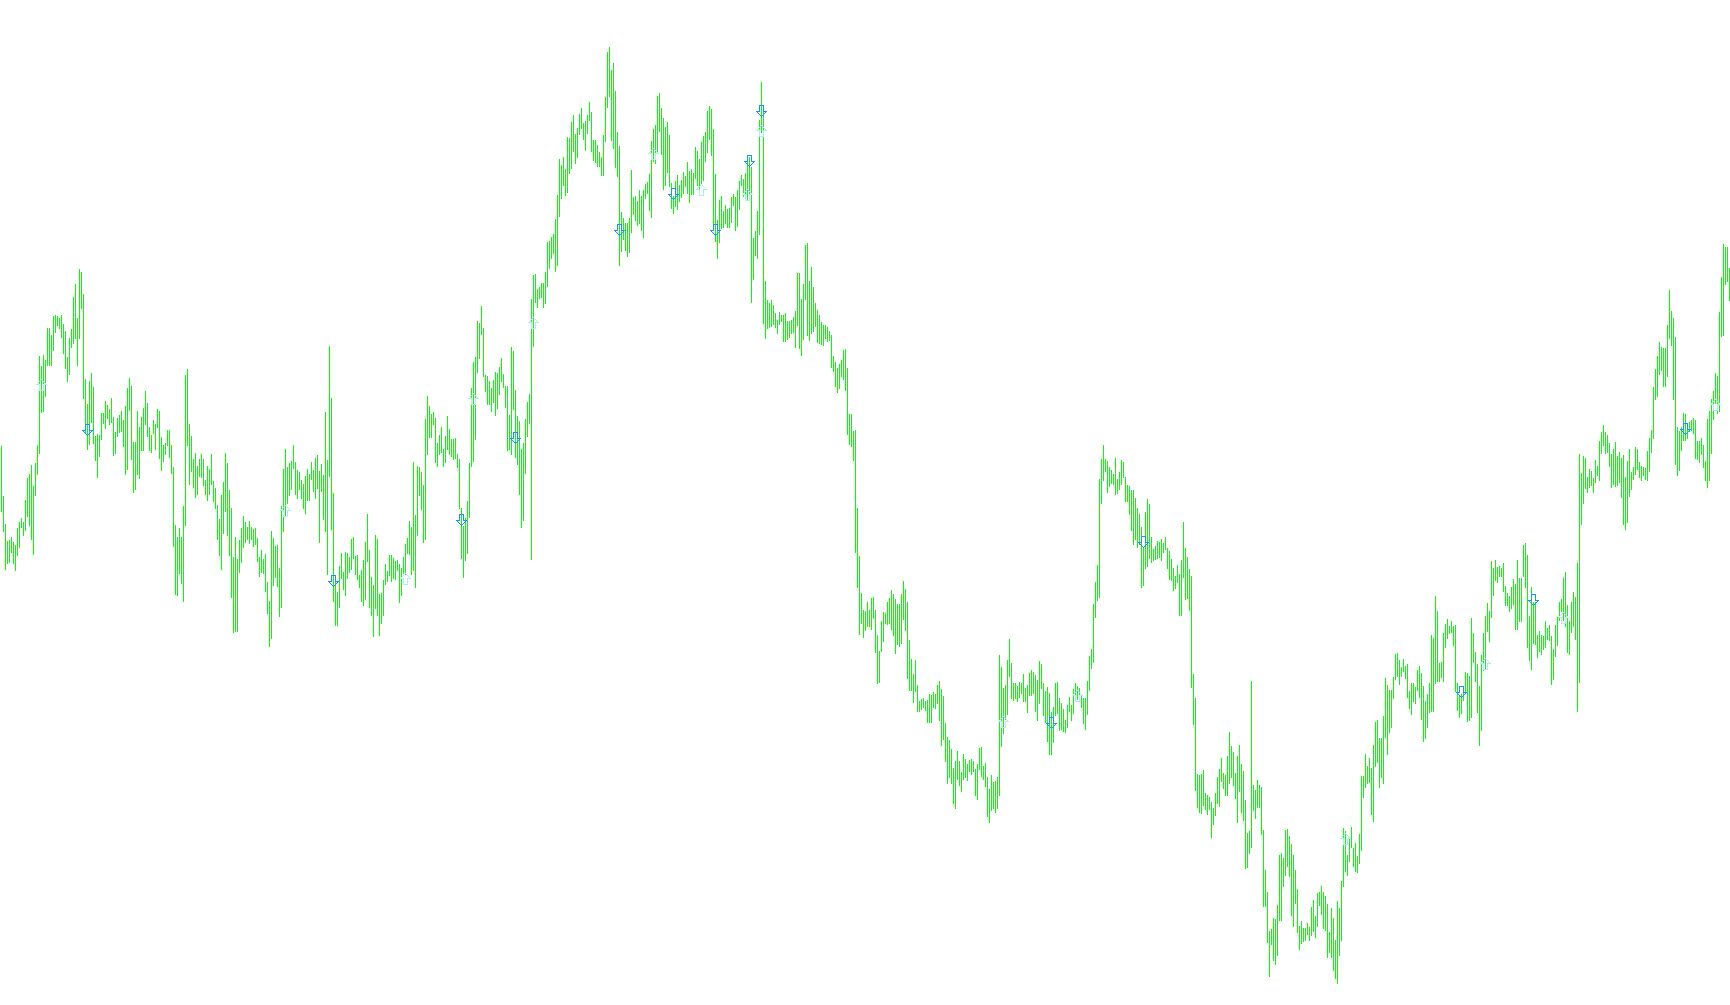
This script is a custom technical analysis tool designed for the MetaTrader platform. It functions as a trend-following signal generator that analyzes price movements across two different timeframes simultaneously to identify high-probability entry points.
Core Logic and Methodology
The tool operates on a "multi-timeframe" logic, meaning it doesn't just look at what is happening right now on your current chart; it cross-references data from a higher timeframe (specifically the 1-hour chart) to confirm trends for the lower timeframe (the 30-minute chart).
The calculation process follows these key steps:
1. Momentum Calculation The script calculates "histograms" by measuring the distance between two different types of moving averages. By subtracting a slower average from a faster one, the tool determines the momentum of the price. If the gap is widening, the trend is gaining strength; if it is narrowing, the trend is weakening.
2. Signal Smoothing To filter out "market noise" and prevent false signals caused by minor price fluctuations, the script applies a third layer of smoothing over the momentum data. This creates a stabilized line that represents the overall health of the trend.
3. Multi-Timeframe Trend Detection The indicator performs a specific scan on the 1-hour timeframe:
- It looks for "crossovers" where the smoothed momentum line moves from negative to positive (potential bullish trend) or from positive to negative (potential bearish trend).
- When these shifts occur on the hourly chart, the script marks these as primary directional anchors.
4. Execution Signal Generation Finally, the script looks at your current 30-minute chart. It checks the momentum data against the "anchors" established by the hourly chart:
- Buy Signals: When the hourly trend turns positive and the current price action confirms a bullish move, the script places an upward arrow on the chart.
- Sell Signals: When the hourly trend turns negative and the current price action confirms a bearish move, the script places a downward arrow on the chart.
Summary for the User
In simple terms, this script acts as a filter. It uses the 1-hour chart to determine the "big picture" direction of the market and then uses the 30-minute chart to pinpoint the exact moment it is safe to enter a trade in that direction. The resulting arrows on your screen represent moments where short-term momentum aligns with long-term trend shifts.
//+------------------------------------------------------------------+
//|                                                KI_signals_v1.mq4 |
//|                                                          Kalenzo |
//|                                      bartlomiej.gorski@gmail.com |
//+------------------------------------------------------------------+
#property copyright "Kalenzo"
#property link      "bartlomiej.gorski@gmail.com"
//----
#property indicator_chart_window
#property indicator_buffers 8
#property indicator_color1 AliceBlue
#property indicator_color2 AliceBlue
#property indicator_color3 DarkViolet
#property indicator_color4 DarkViolet
#property indicator_level1 0
//----
extern int Length1 = 3;
extern int Length2 = 10;
extern int Length3 = 18;
// 60[min] = PERIOD_H1
int period = 60;
//----
double Histo[];
double MaHisto[];
double Histoh1[];
double MaHistoh1[];
double up[];
double dn[];
double uph1[];
double dnh1[];
//+------------------------------------------------------------------+
//| Custom indicator initialization function                         |
//+------------------------------------------------------------------+
int init()
{
//---- additional buffers are used for counting
   IndicatorBuffers(8);
   SetIndexStyle(0,DRAW_ARROW,EMPTY,1);
   SetIndexStyle(1,DRAW_ARROW,EMPTY,1);
   SetIndexStyle(2,DRAW_ARROW,EMPTY,1);
   SetIndexStyle(3,DRAW_ARROW,EMPTY,1);
   SetIndexArrow(0,241);
   SetIndexArrow(1,242);
   SetIndexArrow(2,241);
   SetIndexArrow(3,242);
//   IndicatorDigits(6);
   SetIndexBuffer(0,up);
   SetIndexBuffer(1,dn);
   SetIndexBuffer(2,uph1);
   SetIndexBuffer(3,dnh1);
   SetIndexBuffer(4,Histoh1);
   SetIndexBuffer(5,MaHistoh1);
   SetIndexBuffer(6,Histo);
   SetIndexBuffer(7,MaHisto);
//   IndicatorShortName("KI signals v1");
   return(0);
}
int start()
  {
   int limit;
   int counted_bars;// = IndicatorCounted();
   int tmp, i, j, m;
   // this is fro M30 (we are on it), but we want for H1
   counted_bars = IndicatorCounted();
   if(counted_bars<0) counted_bars=0;
   if(counted_bars>0) counted_bars--;
  // ----------- H1
   // this is for H1, but counted_bars is for M30
   // so...
   limit = (Bars-counted_bars)/(period/Period()) + 1;
//   limit=iBars(Symbol(),period)-1;//counted_bars;
   for (i = 0 ;i <= limit ;i++)Histoh1[i] = iMA(Symbol(),period,Length1,0,MODE_EMA,PRICE_CLOSE,i) - iMA(Symbol(),period,Length2,0,MODE_EMA,PRICE_CLOSE,i);
   for (j = 0 ;j <= limit ;j++)MaHistoh1[j] = iMAOnArray(Histoh1,0,Length3,0,MODE_EMA,j);
   for (m = 0 ;m <= limit ;m++)
   {
      if(MaHistoh1[m+1] <= 0 && MaHistoh1[m]>0)
      {
         tmp = iTime (Symbol(),period,m);
         for (j = 0; j < Bars; j++)
         {
           if (iTime(Symbol(),0,j) == tmp)
            uph1[j-period/Period()+1] = iOpen(Symbol(),period,m)-(20*Point);
         }
      }
      if(MaHistoh1[m+1] >= 0 && MaHistoh1[m]<0)
      {
         tmp = iTime (Symbol(),period,m);
         for (j = 0; j < Bars; j++)
         {
           if (iTime(Symbol(),0,j) == tmp)
            dnh1[j-period/Period()+1] = iOpen(Symbol(),period,m)+(20*Point);
         }
      }
   }
// ----------- M30
  counted_bars = IndicatorCounted();
//----
  if(counted_bars<0) counted_bars=0;
  if(counted_bars>0) counted_bars--;
//----
  limit=Bars-counted_bars;
//----
   for (i = 0 ;i <= limit ;i++)Histo[i] = iMA(Symbol(),0,Length1,0,MODE_EMA,PRICE_CLOSE,i) - iMA(Symbol(),0,Length2,0,MODE_EMA,PRICE_CLOSE,i);
   for (j = 0 ;j <= limit ;j++)MaHisto[j] = iMAOnArray(Histo,0,Length3,0,MODE_EMA,j);
   for (m = 0 ;m <= limit ;m++)
   {
      if(MaHisto[m+1] <= 0 && MaHisto[m]>0)
      {
        for (i = m+1; i < limit; i++)
        {
          if (uph1[i] != dnh1[i])
          {
            if (uph1[i] < dnh1[i])
              up[m] = iOpen(Symbol(),0,m)-(20*Point);
            else
              break;
          }
        }
      }
      if(MaHisto[m+1] >= 0 && MaHisto[m]<0)
      {
        for (i = m+1; i < limit; i++)
        {
          if (uph1[i] != dnh1[i])
          {
            if (uph1[i] > dnh1[i])
              dn[m] = iOpen(Symbol(),0,m)+(20*Point);
            else
              break;
          }
        }
      }
   }
  return(0);
}
//+------------------------------------------------------------------+
Comments