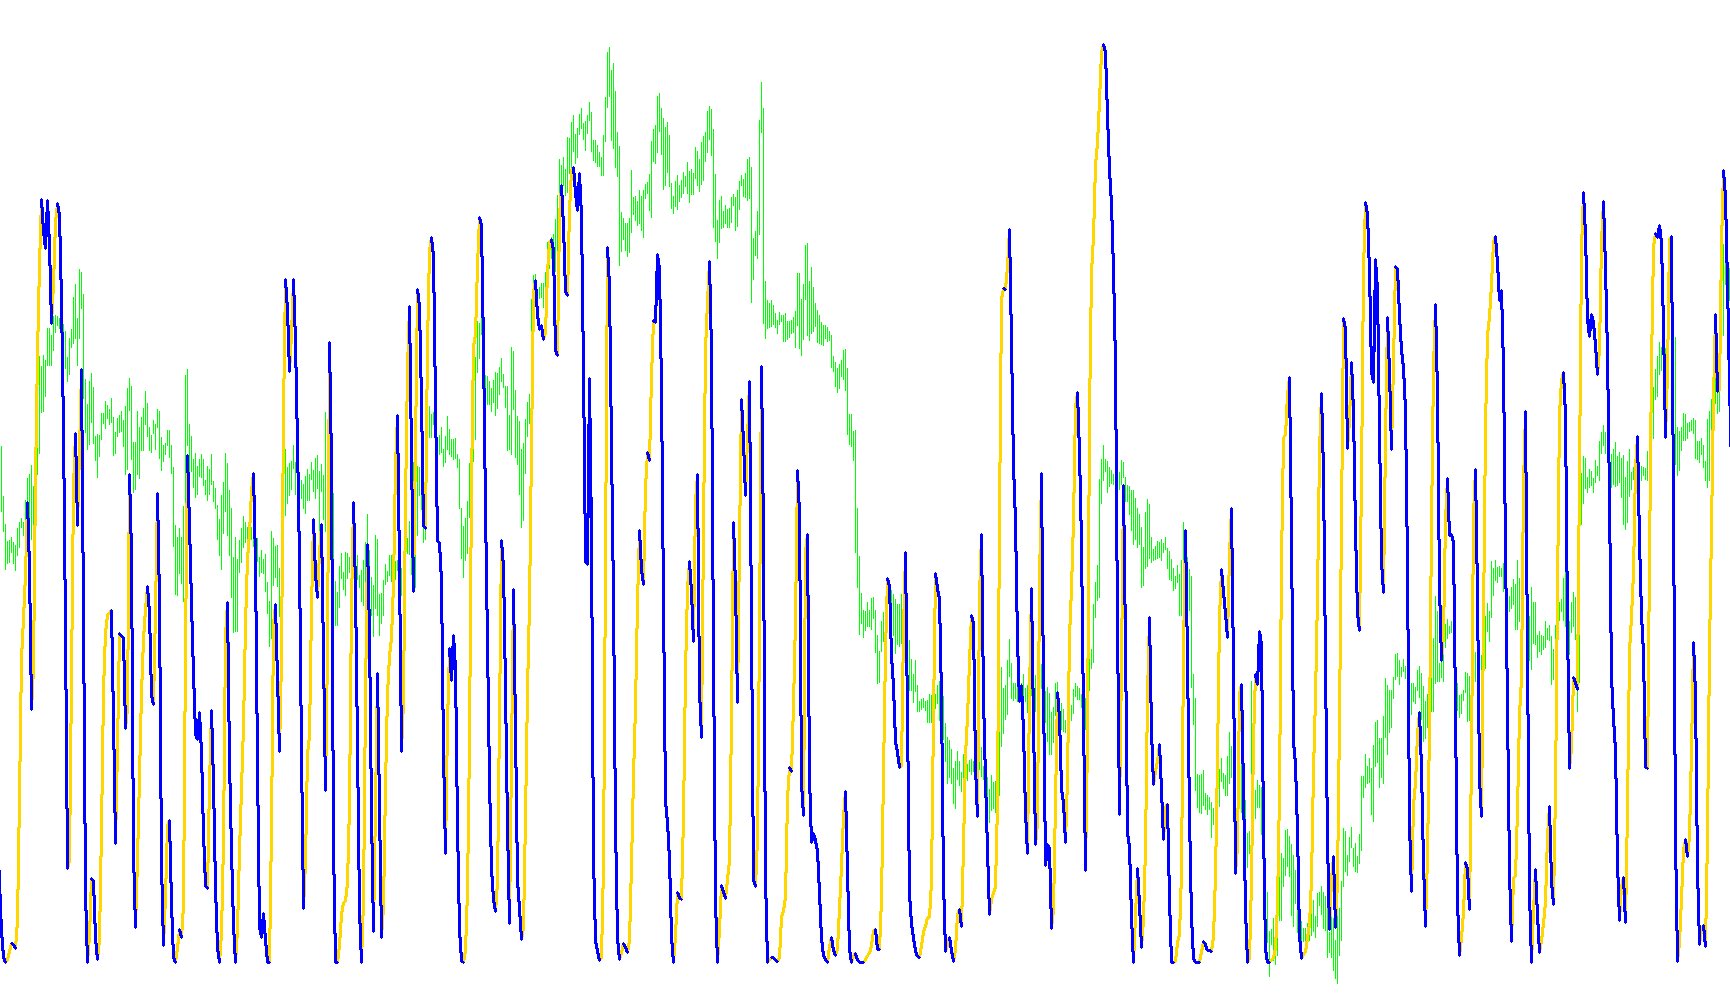
This technical indicator is designed to provide traders with a visual representation of market momentum and trend direction by synthesizing three distinct types of price action data into a single, smoothed output. Instead of relying on just one market signal, it creates a composite "formula" that helps filter out market noise.
How the Logic Works
1. Data Gathering (The Ingredients) The script begins by pulling information from three standard technical analysis tools simultaneously:
- Stochastic Oscillator: Measures the relative position of recent prices compared to a previous range to identify overbought or oversold conditions.
- Relative Strength Index (RSI): Evaluates the speed and magnitude of recent price changes to determine if an asset is gaining or losing strength.
- Momentum: Measures the rate of change in price over a specific period.
2. The Composite Calculation The script combines these three values using a specific mathematical relationship: it multiplies the Stochastic value by the RSI value, and then divides that result by the Momentum value. By doing this, the indicator attempts to create a unique "signature" of the current market environment, balancing volatility, strength, and speed into one unified number.
3. Smoothing and Trend Identification Because raw market data can be erratic (choppy), the script applies a Moving Average to the calculated formula. This "smooths out" the line so that it is easier for a human trader to read without being distracted by minor price fluctuations.
4. Visual Output The final step of the logic involves identifying the direction of the trend:
- Trend Tracking: The indicator compares the current value of the smoothed formula against the previous one.
- Visual Separation: If the formula is rising, it is plotted as a specific line (Blue). If the formula is falling, it is plotted as a different line (Red).
Summary for Traders
In essence, this tool acts as a "trend filter." Rather than showing you raw price movements, it calculates a customized momentum score based on three different dimensions of market activity. It then translates that score into a clear visual cue: when the lines move in one direction, it signals an upward trend; when they move in the opposite direction, it signals a downward trend.
//+------------------------------------------------------------------+
//|                                                                  |
//|                 Copyright © 1999-2008, MetaQuotes Software Corp. |
//|                                         http://www.metaquotes.ru |
//+------------------------------------------------------------------+
#property copyright "Metatrader4 Code by jjk2. Based on MBA Thesis from Simon Fraser University written by C.E. ALDEA."
#property link      ""
#property indicator_separate_window
#property indicator_buffers 2
#property indicator_color1 Blue
#property indicator_color2 Red
//----
extern int Count_Bars=1000;
//---- buffers
double ExtMapBuffer1[];
double ExtMapBuffer2[];
double ExtMapBuffer3[];
double Formula[];
//+------------------------------------------------------------------+
//| Custom indicator initialization function                         |
//+------------------------------------------------------------------+
int init()
  {
//---- indicator drawing
   IndicatorBuffers(4);
   SetIndexStyle(0,DRAW_LINE,STYLE_SOLID,3);
   SetIndexBuffer(0,ExtMapBuffer1);
   SetIndexStyle(1,DRAW_LINE,STYLE_SOLID,3);
   SetIndexBuffer(1,ExtMapBuffer3);
   SetIndexStyle(2,DRAW_NONE,STYLE_SOLID,3,Yellow);//DRAW_NONE,EMPTY,EMPTY);
   SetIndexBuffer(2,ExtMapBuffer2);
   SetIndexBuffer(3,Formula);
   ///-----Name of Indicator
   string short_name="ZigZag BETA    Current value calculated by indicator:";
   IndicatorShortName(short_name);
//----
   return(0);
  }
//+------------------------------------------------------------------+
//| Custom indicator deinitialization function                       |
//+------------------------------------------------------------------+
int deinit()
  {
//----
//----
   return(0);
  }
//+------------------------------------------------------------------+
//| Custom indicator iteration function                              |
//+------------------------------------------------------------------+
int start()
  {
   int pos=0;
   if (Count_Bars>Bars) {pos=Bars;}else{pos=Count_Bars;}
   int temp=pos;
   while(pos>=0)
     {
      //string xxx = "pos";
      double Stoch=iStochastic(NULL,0,9,6,2,MODE_SMA,1,0,pos);
      double RSI=iRSI(NULL,0,9,PRICE_CLOSE,pos);
      double moment=(iMomentum(NULL,0,9,PRICE_CLOSE,pos));
      //Main Forumla
      //double preFormula = (/Momentum);
      if (moment!=0)
         ExtMapBuffer2[pos]=Stoch*(RSI)/moment;
      //Alert("MACD: ", MACD," ","Stoch: ", Stoch," ", "RSI: ", RSI," ","Momentum: ", momentum," ","Volume: ", Volu);
      //Alert(Stoch*(RSI)/Roc);
      pos--;
     }
     while(temp >=0)
     {
      ExtMapBuffer1[temp]=EMPTY_VALUE;
      ExtMapBuffer3[temp]=EMPTY_VALUE;
      Formula[temp]=iMAOnArray(ExtMapBuffer2,0,2,0,MODE_SMA,temp);
        if (Formula[temp]>Formula[temp+1])
        {
         ExtMapBuffer1[temp]=Formula[temp];
         if (ExtMapBuffer1[temp+1]==EMPTY_VALUE) ExtMapBuffer1[temp+1]=Formula[temp+1];
         }
         else
         {
         ExtMapBuffer3[temp]=Formula[temp];
         if (ExtMapBuffer3[temp+1]==EMPTY_VALUE) ExtMapBuffer3[temp+1]=Formula[temp+1];
        }
     temp--;
     }
//----
   return(0);
  }
//+------------------------------------------------------------------+
Comments