Trend Trigger Modified(6AUG05)
Download script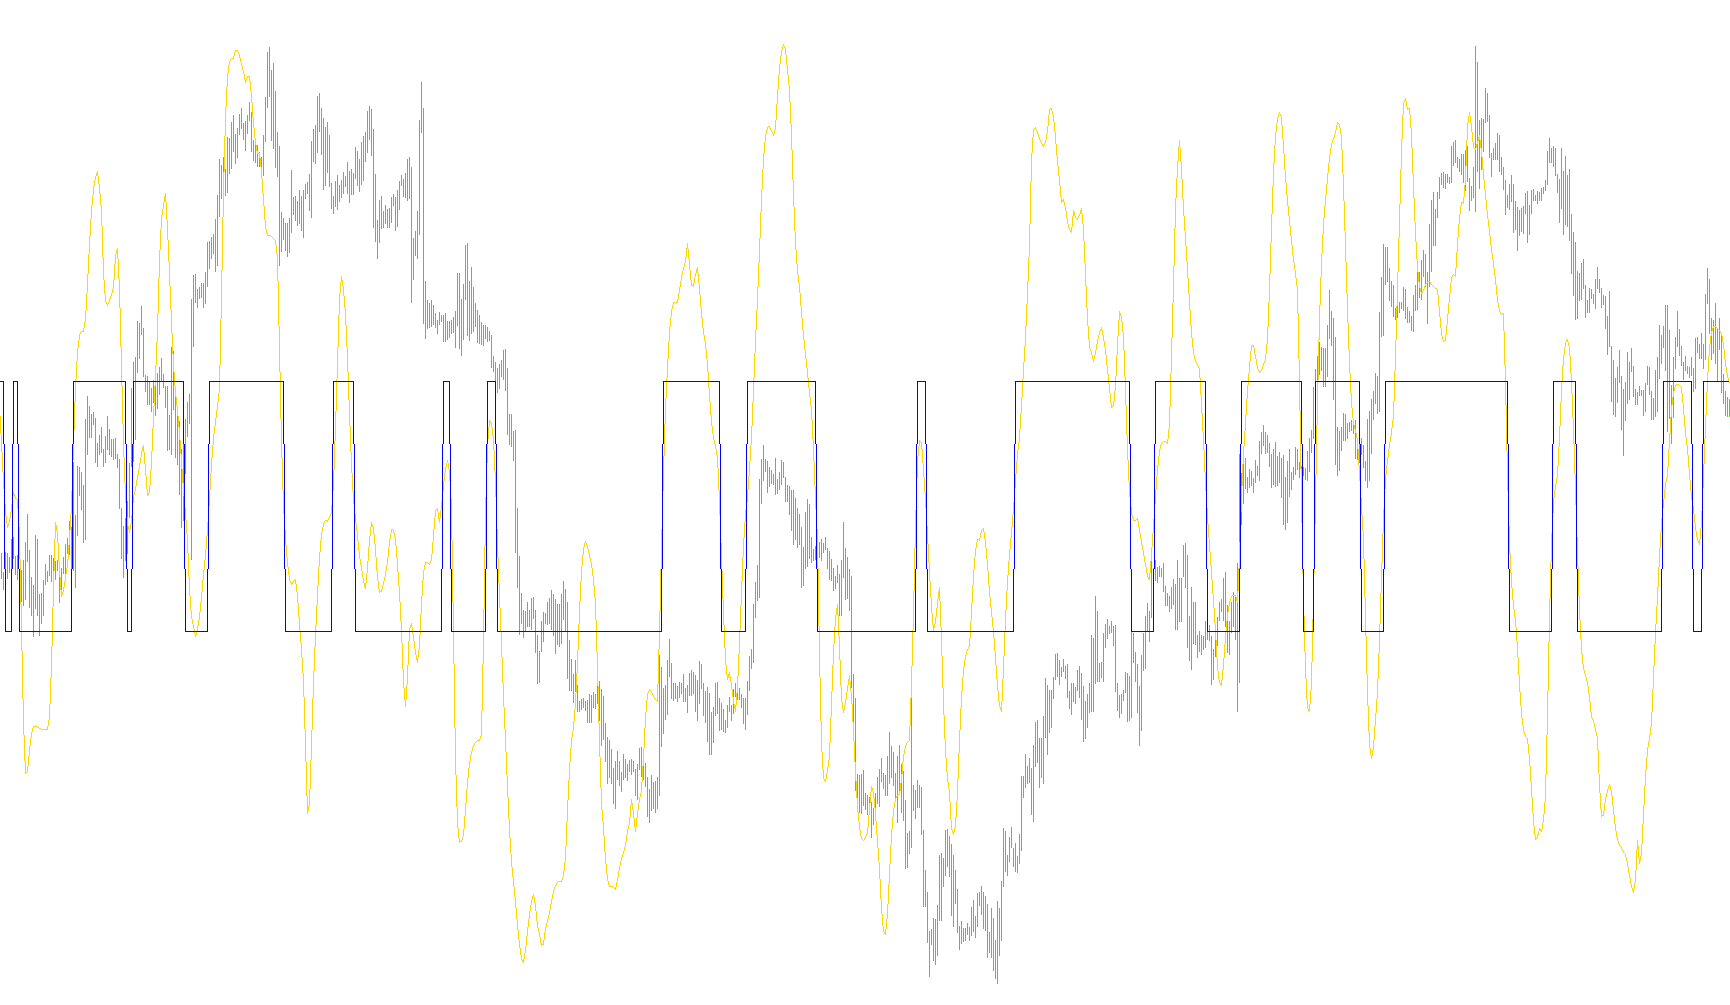
This tool is designed to help traders visualize market momentum by calculating the balance between "buying strength" and "selling strength." Rather than just looking at current price, it analyzes recent price extremes to determine which side of the market holds more power.
How the Logic Works
1. Identifying Price Extremes The script looks at two distinct windows of time on the chart. It identifies the highest peaks and lowest valleys in a "Recent" window (the most current data) and compares them against a "Past" window (data that occurred slightly further back).
2. Calculating Market Power To determine the direction of the trend, the script calculates two specific metrics:
- Buy Power: This measures the distance between the recent highs and the older lows. A larger gap suggests strong upward momentum.
- Sell Power: This measures the distance between the older highs and the recent lows. A larger gap suggests strong downward momentum.
3. The Trend Trigger Calculation The tool combines these two power metrics into a single percentage-based value. By comparing Buy Power against Sell Power, it produces a "Trend Trigger" value. This value tells you whether the market is leaning more toward the buyers or the sellers at any given moment.
4. Smoothing and Filtering Raw market data can be very "noisy" and jump around erratically. To make the information easier for a human to read, the script applies a multi-stage smoothing process (similar to a moving average). This filters out minor price fluctuations so that the user can see the underlying trend more clearly without being distracted by every tiny tick in price.
5. Visual Output The results are displayed in a separate window below your main chart:
- The Main Line: Represents the smoothed Trend Trigger value.
- The Threshold: The script uses a baseline to provide clear visual cues. When the trend is positive, it reflects one side of the market; when the trend turns negative, it signals a shift in dominance to the other side.
In short, this tool acts as a momentum gauge, stripping away the noise of the market to show you which "force"—buying or selling—is currently winning the tug-of-war.
//+------------------------------------------------------------------+
//|                                       Trend Trigger Modified.mq4 |
//|                      Copyright © 2005, MetaQuotes Software Corp. |
//|                                        http://www.metaquotes.net |
//+------------------------------------------------------------------+
#property copyright "Copyright © 2005, MetaQuotes Software Corp."
#property link      "http://www.metaquotes.net"

#property indicator_separate_window
#property indicator_buffers 2
#property indicator_color1 SkyBlue
#property indicator_color2 LightSeaGreen
//---- input parameters
extern int       TTFbars=15;
extern int       t3_period=5;
extern double    b=0.7;
//---- buffers
double Buf1[];
double Buf2[];

// Variable Specific:
string IndicatorName = "py.TTF";
string Version = "S01";
double HighestHighRecent,
       HighestHighOlder,
       LowestLowRecent,
       LowestLowOlder,
       BuyPower,
       SellPower,TTF;
double t3,e1,e2,e3,e4,e5,e6,c1,c2,c3,c4,r,w1,w2,b2,b3;

//+------------------------------------------------------------------+
//| Custom indicator initialization function                         |
//+------------------------------------------------------------------+
int init()
  {
//---- indicators
   SetIndexStyle(0,DRAW_LINE);
   SetIndexBuffer(0,Buf1);
   SetIndexStyle(1,DRAW_LINE);
   SetIndexBuffer(1,Buf2);

   b2 = b * b;
   b3 = b2 * b;
   c1 = (-b3);
   c2 = (3 * (b2 + b3));
   c3 = (-3) * (2 * b2 + b + b3);
   c4 = (1 + 3 * b + b3 + 3 * b2);

   r = t3_period;

   if (r < 1) r = 1;
   r = 1 + 0.5 * (r - 1);
   w1 = 2 / (r + 1);
   w2 = 1 - w1 ;
//----
   return(0);
  }
//+------------------------------------------------------------------+
//| Custor indicator deinitialization function                       |
//+------------------------------------------------------------------+
int deinit()
  {
//----

//----
   return(0);
  }
//+------------------------------------------------------------------+
//| Custom indicator iteration function                              |
//+------------------------------------------------------------------+
int start()
  {
   int    counted_bars=IndicatorCounted();
//----
   int limit = Bars-counted_bars-1;
   for(int i=limit; i>0; i--)
   {
     HighestHighRecent = High[Highest(NULL,0,MODE_HIGH,TTFbars,i)];
	  HighestHighOlder = High[Highest(NULL,0,MODE_HIGH,TTFbars,i + TTFbars)];
	  LowestLowRecent = Low [Lowest(NULL,0,MODE_LOW,TTFbars,i)];
	  LowestLowOlder = Low [Lowest(NULL,0,MODE_LOW,TTFbars,i+TTFbars)];
	  BuyPower = HighestHighRecent - LowestLowOlder;
	  SellPower = HighestHighOlder - LowestLowRecent;
	  TTF = (BuyPower - SellPower) / (0.5 * (BuyPower + SellPower)) * 100;

	  e1 = w1 * TTF + w2 * e1;
	  e2 = w1 * e1 + w2 * e2;
	  e3 = w1 * e2 + w2 * e3;
	  e4 = w1 * e3 + w2 * e4;
	  e5 = w1 * e4 + w2 * e5;
	  e6 = w1 * e5 + w2 * e6;

	  TTF = c1 * e6 + c2 * e5 + c3 * e4 + c4 * e3;
     Buf1[i] = TTF;
     if (TTF >= 0) Buf2[i] = 50;
     else Buf2[i] = -50;
   }
//----
   return(0);
  }
//+------------------------------------------------------------------+
Comments