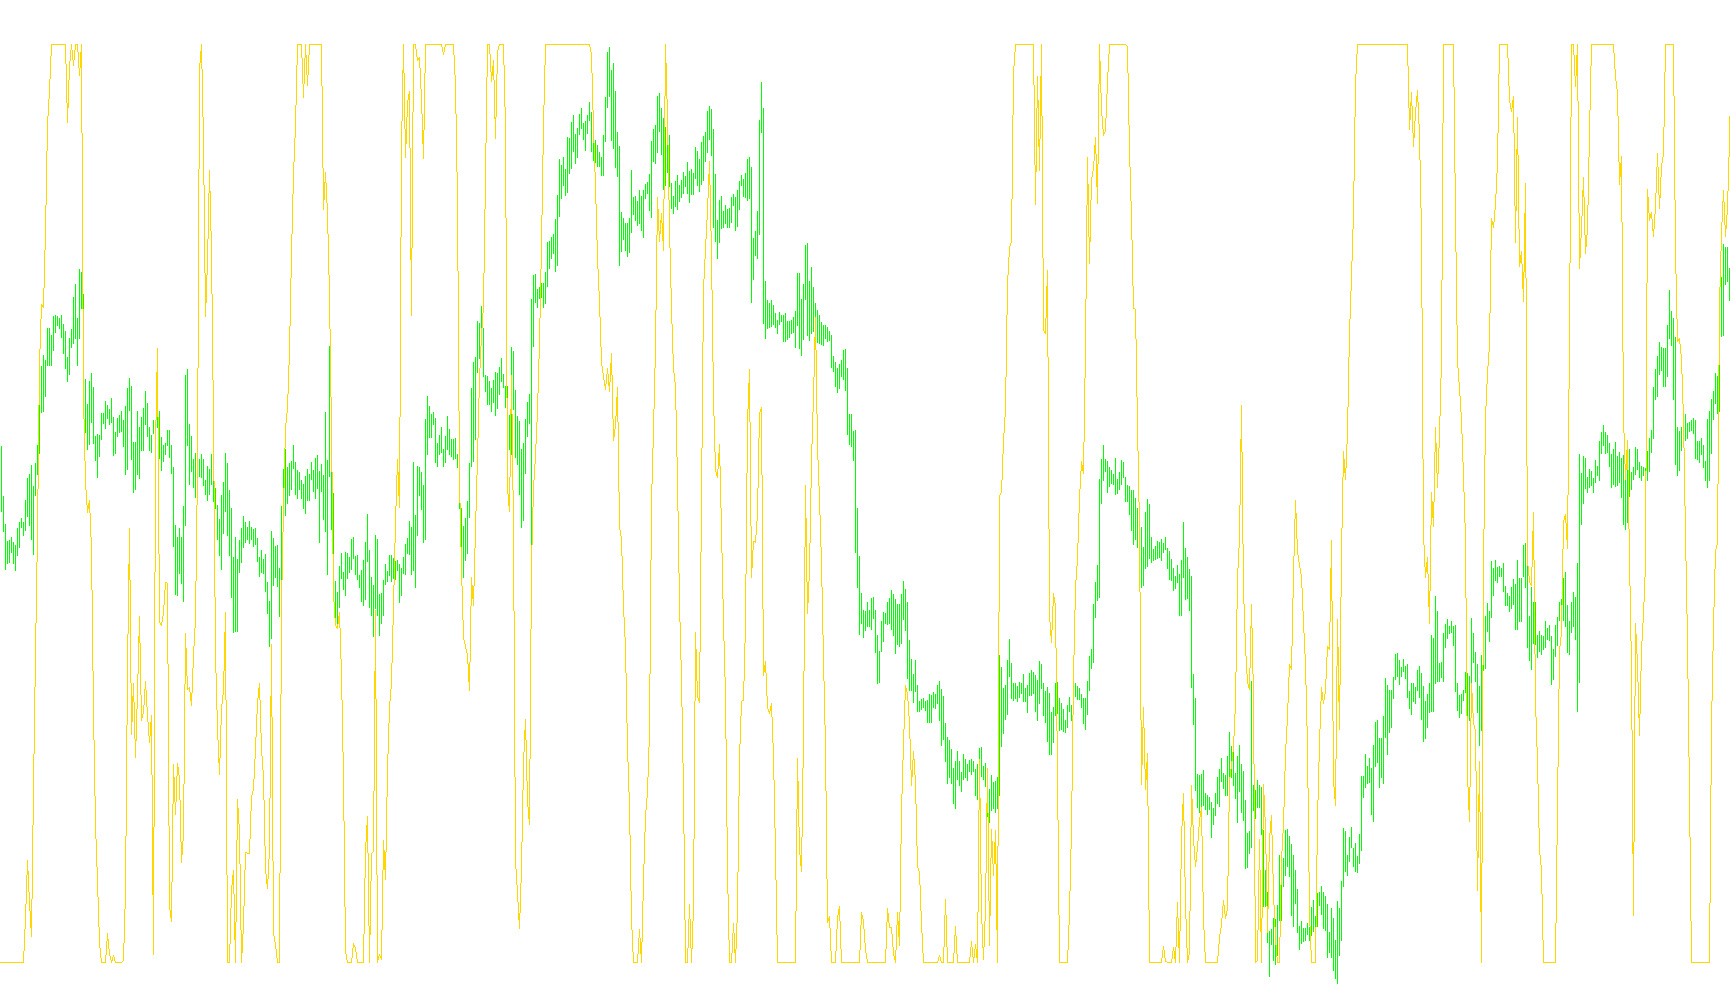
This script is a custom technical analysis tool designed for the MetaTrader platform. It functions as a visual indicator that tracks and displays momentum dynamics by analyzing price action over a specific historical period.
Core Logic Overview
The primary objective of this tool is to measure "momentum flow" by comparing the current price movement against previous price trends. Instead of looking at raw price points, it calculates a normalized value (ranging between 0 and 1) that represents the strength of the upward trend relative to the downward trend.
How It Works
The logic follows a three-step process:
1. Smoothing the Data The script takes the closing prices of the market and applies a weighted smoothing technique. It uses a specific constant (referred to as "gamma") to blend current price data with historical values. This helps filter out "market noise" or minor fluctuations, allowing the indicator to focus on more significant, sustained price movements.
2. Calculating Momentum Differences Once the price data is smoothed, the script creates four distinct layers of moving averages (L0 through L3). It then calculates the difference between these layers:
- It measures how much the most recent trend is pulling away from the one before it.
- It repeats this for the subsequent layers to determine the "velocity" of the price change.
3. Determining the Strength Ratio The final step combines these differences into a single ratio. By comparing the sum of all upward movements (positive differences) against the sum of all downward movements (negative differences), it produces a percentage-like value:
- If the upward momentum is dominant, the indicator moves toward the top of its scale.
- If the downward momentum is dominant, the indicator moves toward the bottom.
Practical Application
The result is displayed in a separate window on your chart. By observing where the line sits relative to the pre-defined levels (0.85, 0.45, and 0.15), you can visually identify whether the market is currently leaning heavily toward a bullish trend, a bearish trend, or if it is处于 a state of equilibrium. This allows traders to see the "pulse" of the market's strength at a glance.
//+------------------------------------------------------------------+
//|                                                     Whatever.mq4 |
//|                                                    James Adefuye |
//|                                          james.adefuye@yahoo.com |
//+------------------------------------------------------------------+
#property copyright "James Adefuye"
#property link      "james.adefuye@yahoo.com"

#property indicator_separate_window
#property indicator_color1 Magenta
#property indicator_level2 0.85
#property indicator_level3 0.45
#property indicator_level4 0.15
//---- input parameters
extern double gamma=0.7;
extern int CountBars=9500;

double L0 = 0;
double L1 = 0;
double L2 = 0;
double L3 = 0;
double L0A = 0;
double L1A = 0;
double L2A = 0;
double L3A = 0;
double LRSI = 0;
double CU = 0;
double CD = 0;

double val1[];
//+------------------------------------------------------------------+
//| Custom indicator initialization function                         |
//+------------------------------------------------------------------+

int init()
  {
//---- indicators
//----
   SetIndexBuffer(0,val1);
   return(0);
  }
//+------------------------------------------------------------------+
//| Custor indicator deinitialization function                       |
//+------------------------------------------------------------------+
int deinit()
  {
//---- TODO: add your code here

//----
   return(0);
  }
//+------------------------------------------------------------------+
//| Custom indicator iteration function                              |
//+------------------------------------------------------------------+
int start()
  {
   if (CountBars>Bars) CountBars=Bars;
   SetIndexDrawBegin(0,Bars-CountBars);

   int i;
   int    counted_bars=IndicatorCounted();

   //if(CountBars<=Lookback) return(0);
   //---- initial zero
   //if(counted_bars<1)
   //{
   //   for(i=1;i<=Lookback;i++) val1[CountBars-i]=0.0;
   //}

   i=CountBars-1;
   while(i>=0)
   {
      L0A = L0;
      L1A = L1;
      L2A = L2;
      L3A = L3;
      L0 = (1 - gamma)*Close[i] + gamma*L0A;
      L1 = - gamma *L0 + L0A + gamma *L1A;
      L2 = - gamma *L1 + L1A + gamma *L2A;
      L3 = - gamma *L2 + L2A + gamma *L3A;

      CU = 0;
      CD = 0;

      if (L0 >= L1) CU = L0 - L1; else CD = L1 - L0;
      if (L1 >= L2) CU = CU + L1 - L2; else CD = CD + L2 - L1;
      if (L2 >= L3) CU = CU + L2 - L3; else CD = CD + L3 - L2;

      if (CU + CD != 0) LRSI = CU / (CU + CD);
      val1[i] = LRSI;
	  i--;
	}
   return(0);
 }
//+------------------------------------------------------------------+
Comments