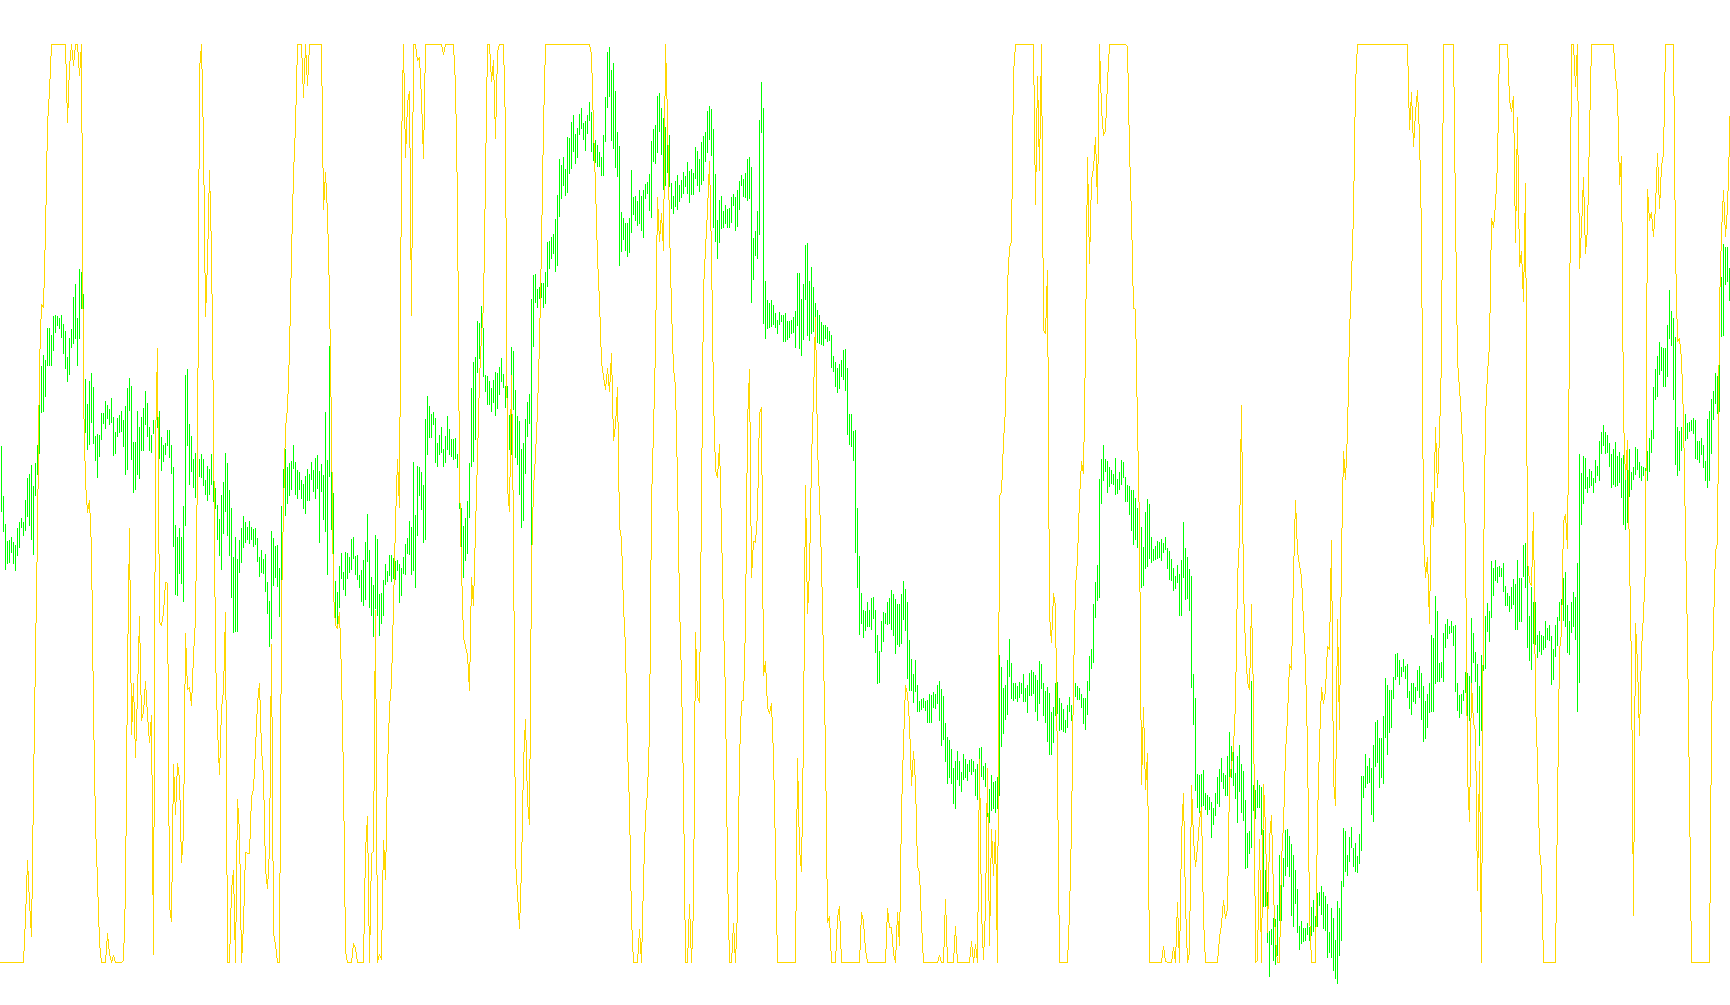
This script is a custom financial indicator designed for the MetaTrader platform to help traders visualize market momentum and price trends. It utilizes a specific mathematical framework known as "Laguerre" logic to smooth out market noise and provide a clearer picture of where the price action is headed.
Core Functionality
The primary goal of this indicator is to calculate a proprietary momentum value that represents the relative strength of current price movements. Instead of simply looking at raw price changes, the script processes historical data through a series of layered calculations to identify the underlying "velocity" of the market.
How the Logic Works
To achieve its results, the script follows a three-step logical process:
1. Smoothing and Weighting The indicator starts by taking the current closing price and blending it with previous values using a specific weighting factor (referred to as gamma). This acts as a sophisticated filter; it helps the tool distinguish between temporary "jitter" in the market and actual, sustained moves in price. By balancing the new price against historical data, the indicator produces a smoother trendline.
2. Multi-Layered Calculation The script doesn't just look at one point of data. It calculates four distinct layers of information simultaneously. Each layer builds upon the previous one, creating a cumulative effect. This allows the indicator to "remember" the history of the trend while remaining responsive to what is happening right now.
3. Momentum Ratio Analysis Finally, the script compares these different layers to determine direction and strength. It calculates:
- Upward Momentum: How much the price is pushing upward across all four layers.
- Downward Momentum: How much the price is pulling downward across all four layers.
By dividing the upward pressure by the total combined movement, the script produces a final value. This value tells you what percentage of the current market move is "positive" versus "negative."
Visual Representation
The result is displayed in a separate window below your main price chart. The indicator uses predefined levels to help traders identify specific zones:
- It identifies high-momentum areas where the price may be overextended.
- It highlights low-momentum areas where the market might be losing steam.
In summary, this tool converts complex price fluctuations into a simplified momentum score, helping you see whether the market's current "push" is gaining strength or beginning to fade.
//+------------------------------------------------------------------+
//|                                                     Laguerre.mq4 |
//|                                                     Emerald King |
//|                                     mailto:info@emerald-king.com |
//+------------------------------------------------------------------+
#property copyright "Emerald King"
#property link      "mailto:info@emerald-king.com"

#property indicator_separate_window
#property indicator_color1 Magenta
#property indicator_level2 0.75
#property indicator_level3 0.45
#property indicator_level4 0.15
//---- input parameters
extern double gamma=0.7;
extern int CountBars=100000;

double L0 = 0;
double L1 = 0;
double L2 = 0;
double L3 = 0;
double L0A = 0;
double L1A = 0;
double L2A = 0;
double L3A = 0;
double LRSI = 0;
double CU = 0;
double CD = 0;

double val1[];
//+------------------------------------------------------------------+
//| Custom indicator initialization function                         |
//+------------------------------------------------------------------+

int init()
  {
//---- indicators
//----
   SetIndexBuffer(0,val1);
   return(0);
  }
//+------------------------------------------------------------------+
//| Custor indicator deinitialization function                       |
//+------------------------------------------------------------------+
int deinit()
  {
//---- TODO: add your code here

//----
   return(0);
  }
//+------------------------------------------------------------------+
//| Custom indicator iteration function                              |
//+------------------------------------------------------------------+
int start()
  {
   if (CountBars>Bars) CountBars=Bars;
   SetIndexDrawBegin(0,Bars-CountBars);

   int i;
   int    counted_bars=IndicatorCounted();

   //if(CountBars<=Lookback) return(0);
   //---- initial zero
   //if(counted_bars<1)
   //{
   //   for(i=1;i<=Lookback;i++) val1[CountBars-i]=0.0;
   //}

   i=CountBars-1;
   while(i>=0)
   {
      L0A = L0;
      L1A = L1;
      L2A = L2;
      L3A = L3;
      L0 = (1 - gamma)*Close[i] + gamma*L0A;
      L1 = - gamma *L0 + L0A + gamma *L1A;
      L2 = - gamma *L1 + L1A + gamma *L2A;
      L3 = - gamma *L2 + L2A + gamma *L3A;

      CU = 0;
      CD = 0;

      if (L0 >= L1) CU = L0 - L1; else CD = L1 - L0;
      if (L1 >= L2) CU = CU + L1 - L2; else CD = CD + L2 - L1;
      if (L2 >= L3) CU = CU + L2 - L3; else CD = CD + L3 - L2;

      if (CU + CD != 0) LRSI = CU / (CU + CD);
      val1[i] = LRSI;
	  i--;
	}
   return(0);
 }
//+------------------------------------------------------------------+
Comments