Laguerre MinusDi
Download script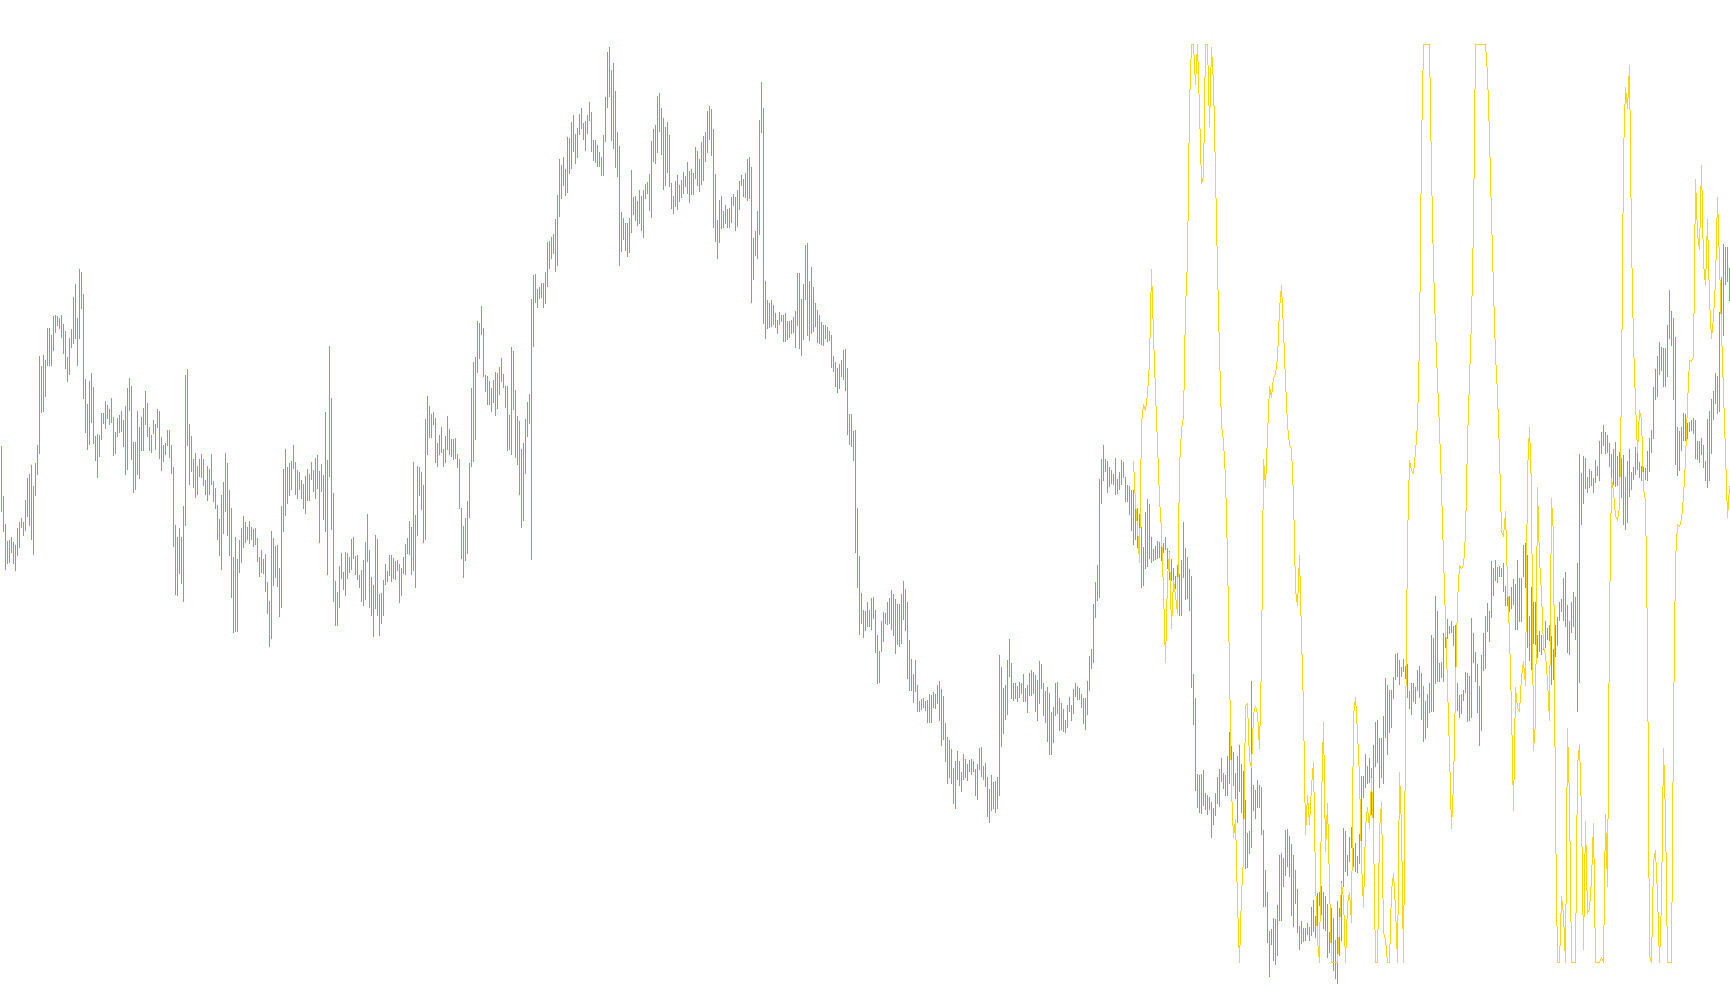
This script is a specialized technical analysis tool designed to provide traders with a smoothed, responsive visual of market momentum. Rather than relying on standard price movement alone, it processes specific data points to identify the underlying strength of a market trend.
Core Logic and Mechanism
The indicator operates by synthesizing several layers of financial mathematics to create a "Laguerre" inspired momentum oscillator. Here is how it processes information step-by-step:
1. Data Foundation (Source Input) The tool begins by looking at the "Minus Directional Indicator" (MINUSDI). In trading terms, this specific metric helps identify the presence and strength of downward price pressure. The script pulls this data based on a user-defined timeframe (the number of periods) to establish a baseline of market behavior.
2. The Smoothing Process (The Laguerre Filter) Instead of jumping erratically with every small price tick, the tool applies a sophisticated filtering technique. It takes the raw data and blends it with its own previous values using a specific weight (known as "gamma"). This creates a recursive effect:
- It calculates four distinct levels of movement (L0 through L3).
- Each level is derived from the one before it, essentially "averaging" the momentum over time.
- This process filters out market "noise" (minor, insignificant price fluctuations) while keeping the primary trend visible and smooth.
3. Momentum Accumulation Once these four levels are established, the script compares them against one another to determine the direction of movement:
- It calculates the differences between each level.
- If the levels are increasing, it adds that value to a "positive" accumulator.
- If they are decreasing, it adds that value to a "negative" accumulator.
4. Final Output (The Oscillator) The final result is a ratio. The script takes the total positive movement and divides it by the sum of all movements (both positive and negative).
What this means for the user
The final output is represented as a value on a separate window on your trading chart. This value typically fluctuates between 0 and 1:
- High Values: Suggest that the "positive" momentum in the filtered data is dominant, indicating bullish strength relative to the chosen settings.
- Low Values: Suggest that the "negative" momentum is more prevalent, indicating bearish pressure.
By using this logic, the tool aims to provide a cleaner, more refined look at market direction than standard indicators, helping traders see where the trend is gaining real weight rather than just reacting to momentary price spikes.
//+--------------------------------------------------------------------------+
//| Laguerre MinusDi.mq4                                                     |
//| Emerald King / transport_david                                           |
//| http://finance.groups.yahoo.com/group/MetaTrader_Experts_and_Indicators/ |
//+--------------------------------------------------------------------------+
#property copyright "Copyright © 2005"
#property link      "http://finance.groups.yahoo.com/group/MetaTrader_Experts_and_Indicators/"

#property indicator_separate_window
#property indicator_minimum -0.05
#property indicator_maximum 1.05
#property indicator_color1 Red
#property indicator_level2 0.75
#property indicator_level3 0.50
#property indicator_level4 0.25
//---- input parameters
extern double periods=14;
extern double timeperiods=0;
extern double gamma=0.764;
extern int CountBars=300;

double L0 = 0;
double L1 = 0;
double L2 = 0;
double L3 = 0;
double L0A = 0;
double L1A = 0;
double L2A = 0;
double L3A = 0;
double LRSI = 0;
double CU = 0;
double CD = 0;

double val1[];
//+------------------------------------------------------------------+
//| Custom indicator initialization function                         |
//+------------------------------------------------------------------+

int init()
  {
//---- indicators
//----
   SetIndexBuffer(0,val1);
   return(0);
  }
//+------------------------------------------------------------------+
//| Custor indicator deinitialization function                       |
//+------------------------------------------------------------------+
int deinit()
  {
//---- TODO: add your code here

//----
   return(0);
  }
//+------------------------------------------------------------------+
//| Custom indicator iteration function                              |
//+------------------------------------------------------------------+
int start()
  {
   if (CountBars>Bars) CountBars=Bars;
   SetIndexDrawBegin(0,Bars-CountBars);

   int i;
   int    counted_bars=IndicatorCounted();

   //if(CountBars<=Lookback) return(0);
   //---- initial zero
   //if(counted_bars<1)
   //{
   //   for(i=1;i<=Lookback;i++) val1[CountBars-i]=0.0;
   //}

   i=CountBars-1;
   while(i>=0)
   {
      L0A = L0;
      L1A = L1;
      L2A = L2;
      L3A = L3;
      L0 = ((1 - gamma)*iADX(NULL,timeperiods,periods,PRICE_LOW,MODE_MINUSDI,i)) + gamma*L0A;
      L1 = ((- gamma *L0) + L0A) + (gamma *L1A);
      L2 = ((- gamma *L1) + L1A) + (gamma *L2A);
      L3 = ((- gamma *L2) + L2A) + (gamma *L3A);

      CU = 0;
      CD = 0;

      if (L0 >= L1) CU = L0 - L1; else CD = L1 - L0;
      if (L1 >= L2) CU = CU + L1 - L2; else CD = CD + L2 - L1;
      if (L2 >= L3) CU = CU + L2 - L3; else CD = CD + L3 - L2;

      if (CU + CD != 0) LRSI = CU / (CU + CD);
      val1[i] = LRSI;
	  i--;
	}
   return(0);
 }
//+------------------------------------------------------------------+
Comments