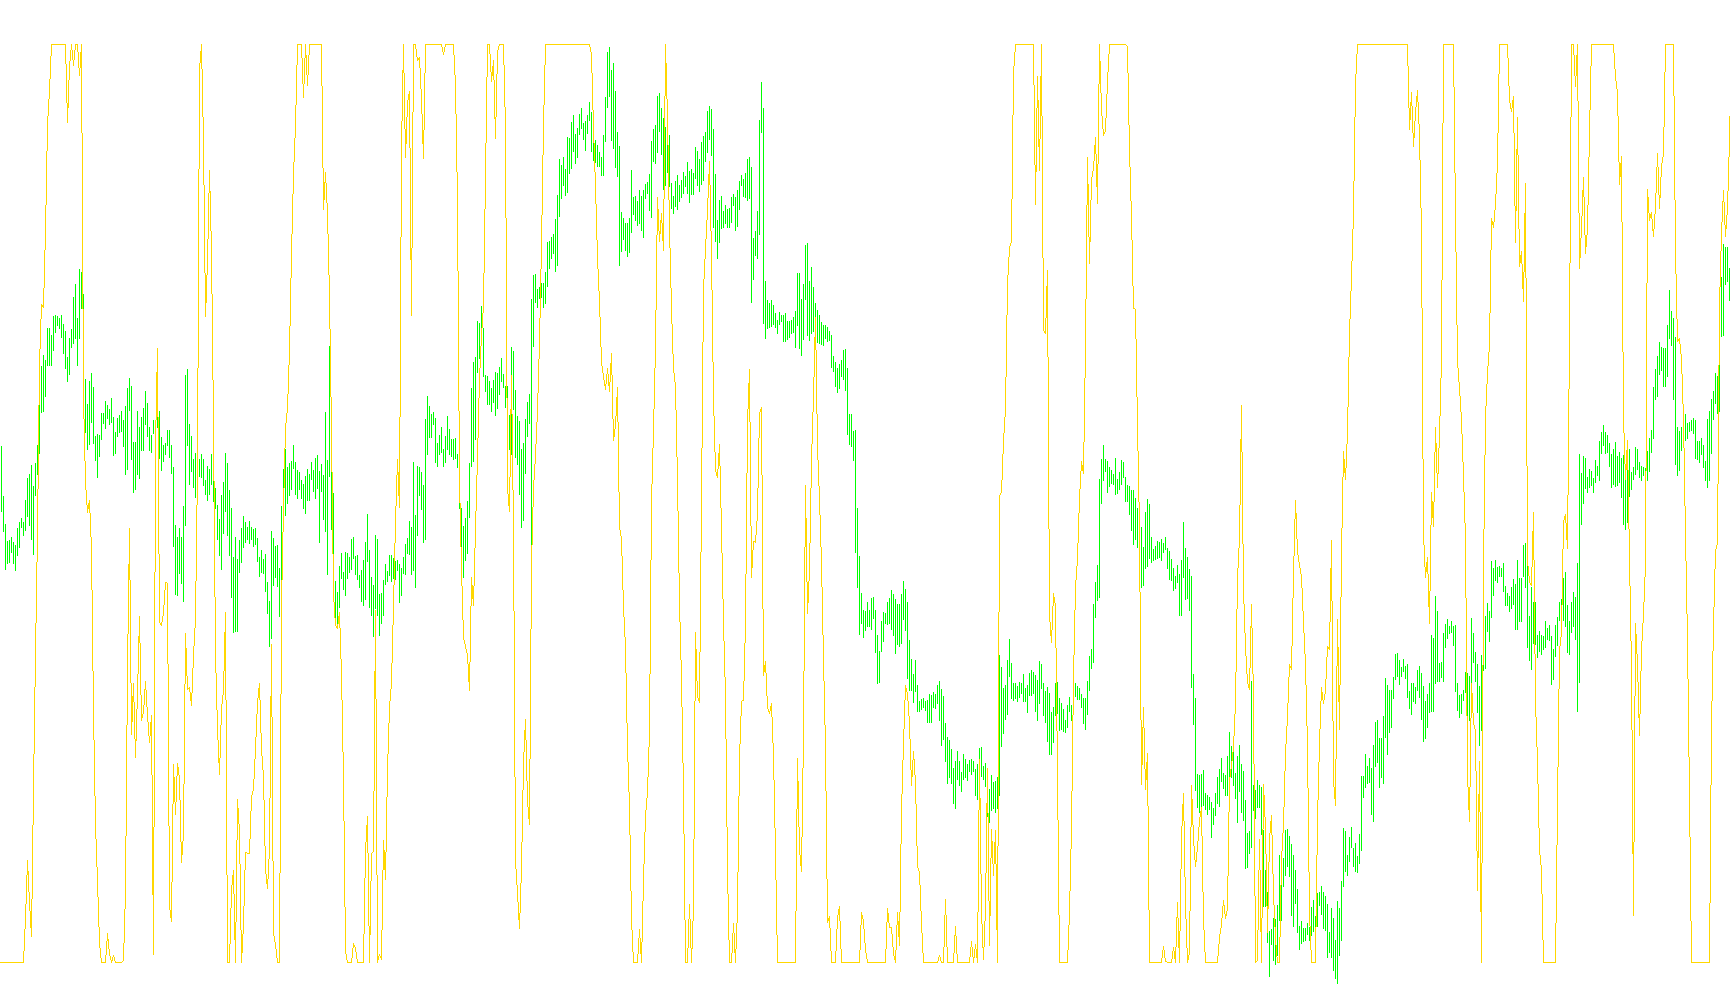
This specialized technical indicator is designed to provide traders with a smoothed, responsive view of market momentum. Rather than following the volatile price swings directly, it processes historical data through a proprietary mathematical filter to highlight the underlying strength and direction of the market trend.
How It Works
The logic operates by calculating a multi-layered progression of price movements. It utilizes a system of "Laguerre" formulas, which are designed to balance two competing needs in trading: responsiveness and smoothness.
Instead of simply looking at the current price, the script creates a sequence of four internal values ($L0$ through $L3$). Each subsequent value is derived from its predecessor combined with a weighted percentage (the "Gamma" factor). This creates a chain of data points that filter out minor "noise" while maintaining the integrity of the broader trend.
Key Functional Components
- The Gamma Factor: A core setting that determines the "sensitivity" of the indicator. By adjusting this, the logic can be tuned to react more quickly to sudden price shifts or to remain more stable during periods of low volatility.
- Cumulative Strength Calculation: The script compares the differences between all four internal values. It calculates the total upward movement (positive pressure) versus the total downward movement (negative pressure).
- The Relative Strength Output: The final result is expressed as a ratio. By dividing the positive pressure by the total combined movement, the indicator produces a value that tells you exactly how dominant the current trend is at any given moment.
Visual Interpretation
The indicator appears in a separate window below your main price chart, oscillating within a specific range.
- When the value leans toward the top of its range, it signifies strong bullish (upward) momentum.
- When the value leans toward the bottom, it indicates dominant bearish (downward) momentum.
- The horizontal levels provided in the script act as boundaries to help traders identify when momentum is reaching extreme levels or shifting from one direction to another.
In summary, this tool acts as a sophisticated "momentum filter." It distills complex price history into a single, readable stream of data, allowing you to see whether the market's energy is moving upward, downward, or remains in a state of equilibrium.
/*-----------------------------+
|			       |
| Shared by www.Aptrafx.com    |
|			       |
+------------------------------*/

//+------------------------------------------------------------------+
//|                                                     Laguerre.mq4 |
//|                                                     Emerald King |
//|                                     mailto:info@emerald-king.com |
//+------------------------------------------------------------------+
#property copyright "Emerald King"
#property link      "mailto:info@emerald-king.com"

#property indicator_separate_window
#property indicator_color1 Magenta
#property indicator_level2 0.75
#property indicator_level3 0.45
#property indicator_level4 0.15
//---- input parameters
extern double gamma=0.7;
extern int CountBars=950;

double L0 = 0;
double L1 = 0;
double L2 = 0;
double L3 = 0;
double L0A = 0;
double L1A = 0;
double L2A = 0;
double L3A = 0;
double LRSI = 0;
double CU = 0;
double CD = 0;

double val1[];
//+------------------------------------------------------------------+
//| Custom indicator initialization function                         |
//+------------------------------------------------------------------+

int init()
  {
//---- indicators
//----
   SetIndexBuffer(0,val1);
   return(0);
  }
//+------------------------------------------------------------------+
//| Custor indicator deinitialization function                       |
//+------------------------------------------------------------------+
int deinit()
  {
//---- TODO: add your code here

//----
   return(0);
  }
//+------------------------------------------------------------------+
//| Custom indicator iteration function                              |
//+------------------------------------------------------------------+
int start()
  {
   if (CountBars>Bars) CountBars=Bars;
   SetIndexDrawBegin(0,Bars-CountBars);

   int i;
   int    counted_bars=IndicatorCounted();

   //if(CountBars<=Lookback) return(0);
   //---- initial zero
   //if(counted_bars<1)
   //{
   //   for(i=1;i<=Lookback;i++) val1[CountBars-i]=0.0;
   //}

   i=CountBars-1;
   while(i>=0)
   {
      L0A = L0;
      L1A = L1;
      L2A = L2;
      L3A = L3;
      L0 = (1 - gamma)*Close[i] + gamma*L0A;
      L1 = - gamma *L0 + L0A + gamma *L1A;
      L2 = - gamma *L1 + L1A + gamma *L2A;
      L3 = - gamma *L2 + L2A + gamma *L3A;

      CU = 0;
      CD = 0;

      if (L0 >= L1) CU = L0 - L1; else CD = L1 - L0;
      if (L1 >= L2) CU = CU + L1 - L2; else CD = CD + L2 - L1;
      if (L2 >= L3) CU = CU + L2 - L3; else CD = CD + L3 - L2;

      if (CU + CD != 0) LRSI = CU / (CU + CD);
      val1[i] = LRSI;
	  i--;
	}
   return(0);
 }
//+------------------------------------------------------------------+
Comments