line_Volum
Download script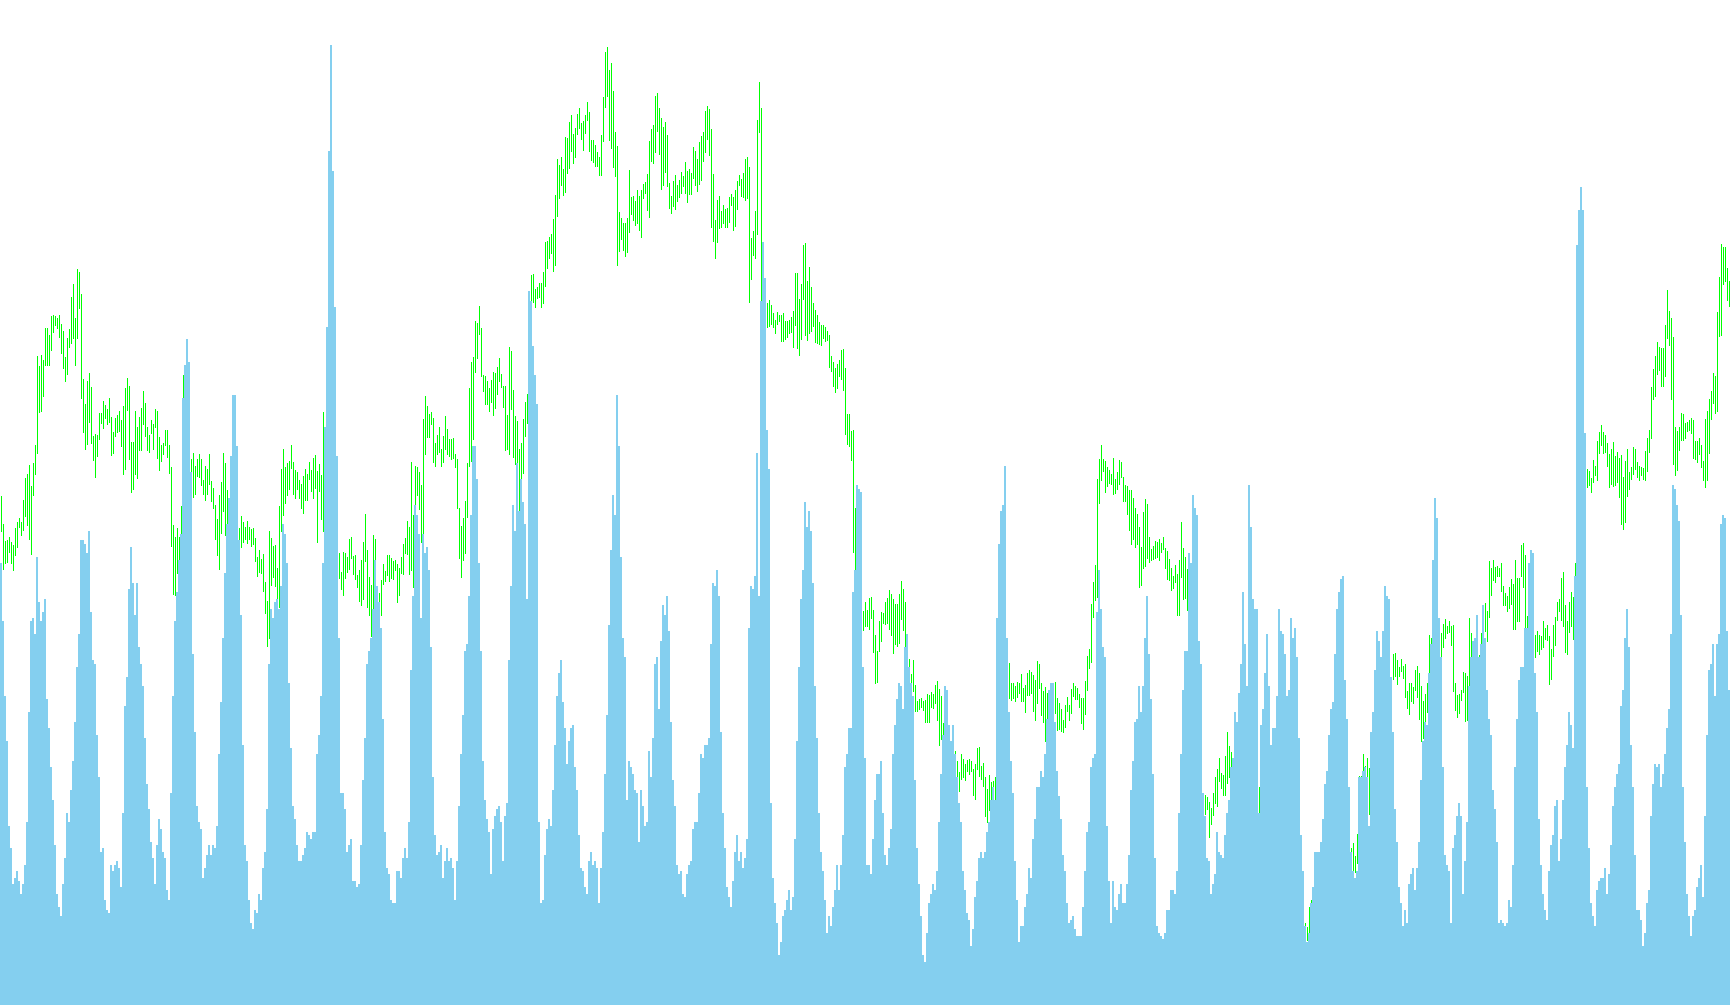
This custom indicator is designed to provide a visual representation of market volatility and price activity by calculating a "Linear Momentum" value. Instead of looking at simple price movements, it focuses on the relationship between current price action and previous closing levels over a specific timeframe.
How the Logic Works
The tool operates by analyzing a specific number of recent candles (defined by the Period setting). For every candle on your chart, the script performs the following logic:
- Price Deviation Tracking: The indicator looks at the high and low prices of the current bars and compares them against the closing price of the preceding bar. It essentially measures how far the market "stretched" away from its previous resting point.
- Movement Calculation:
- If the price moved upward relative to the previous close, it calculates the distance covered between the high of the current move and that previous close.
- If the price moved downward, it calculates the distance between the previous close and the low of the current move.
- In cases where there is no clear directional trend relative to the close, it measures the total range (the distance between the high and the low) of the bar.
- Averaging: To ensure the data is smooth and not overly reactive to single-bar "noise," the script adds up these distances over the entire user-defined period and then divides by that period to find the average movement.
Visual Representation
The result of this calculation is displayed in a separate window below your main price chart as a SkyBlue histogram.
- Height of the Histogram: The height represents the average intensity or "stretch" of the price action over your chosen period.
- Interpretation: A taller histogram indicates higher volatility or larger price swings relative to previous closes, while a shorter histogram suggests a consolidating market with smaller price movements.
By adjusting the Period, you can change the sensitivity of the tool—shorter periods will make the indicator react quickly to immediate price spikes, while longer periods will provide a smoother trend of market volatility over a broader timeframe.
// Ëèíåéíûé îáúåì.mq4
// Èíäèêàòîð

// Ïðåïðîöåññîð
#property copyright "mandorr@gmail.com"
#property indicator_separate_window
#property indicator_buffers 1
#property indicator_width1 2
#property indicator_style1 0
#property indicator_color1 SkyBlue
#property indicator_minimum 0


// Ïàðàìåòðû
extern int period=5;          // Ïåðèîä (êîëè÷åñòâî áàðîâ äèàïàçîíà)
extern int CountBars=10000;   // Êîëè÷åñòâî îòîáðàæàåìûõ áàðîâ

// Ïåðåìåííûå
double buffer[];

void init() {
   IndicatorShortName("Ëèíåéíûé îáúåì ("+period+")");
   IndicatorDigits(0);
   SetIndexStyle(0,DRAW_HISTOGRAM,STYLE_SOLID,2,SkyBlue);
   SetIndexBuffer(0,buffer);
   SetIndexLabel(0,"Value");
   SetIndexDrawBegin(0,0);
   SetIndexEmptyValue(0,0);
}

void deinit() {
}

void start() {
   ArrayInitialize(buffer,0);
   int p=period; if (period<1) p=1;
   for (int i=0;i<=CountBars-1;i++) {
      int length=0;
      for (int j=0;j<=p-1;j++) {
         if (Low[i+j]>Close[i+j+1]) length+=MathRound((High[i+j]-Close[i+j+1])/Point);
         else if (High[i+j]<Close[i+j+1]) length+=MathRound((Close[i+j+1]-Low[i+j])/Point);
         else length+=MathRound((High[i+j]-Low[i+j])/Point);
      }
      buffer[i]=length/p;
   }
}
Comments