Lines_HiLo_CashCow
Download script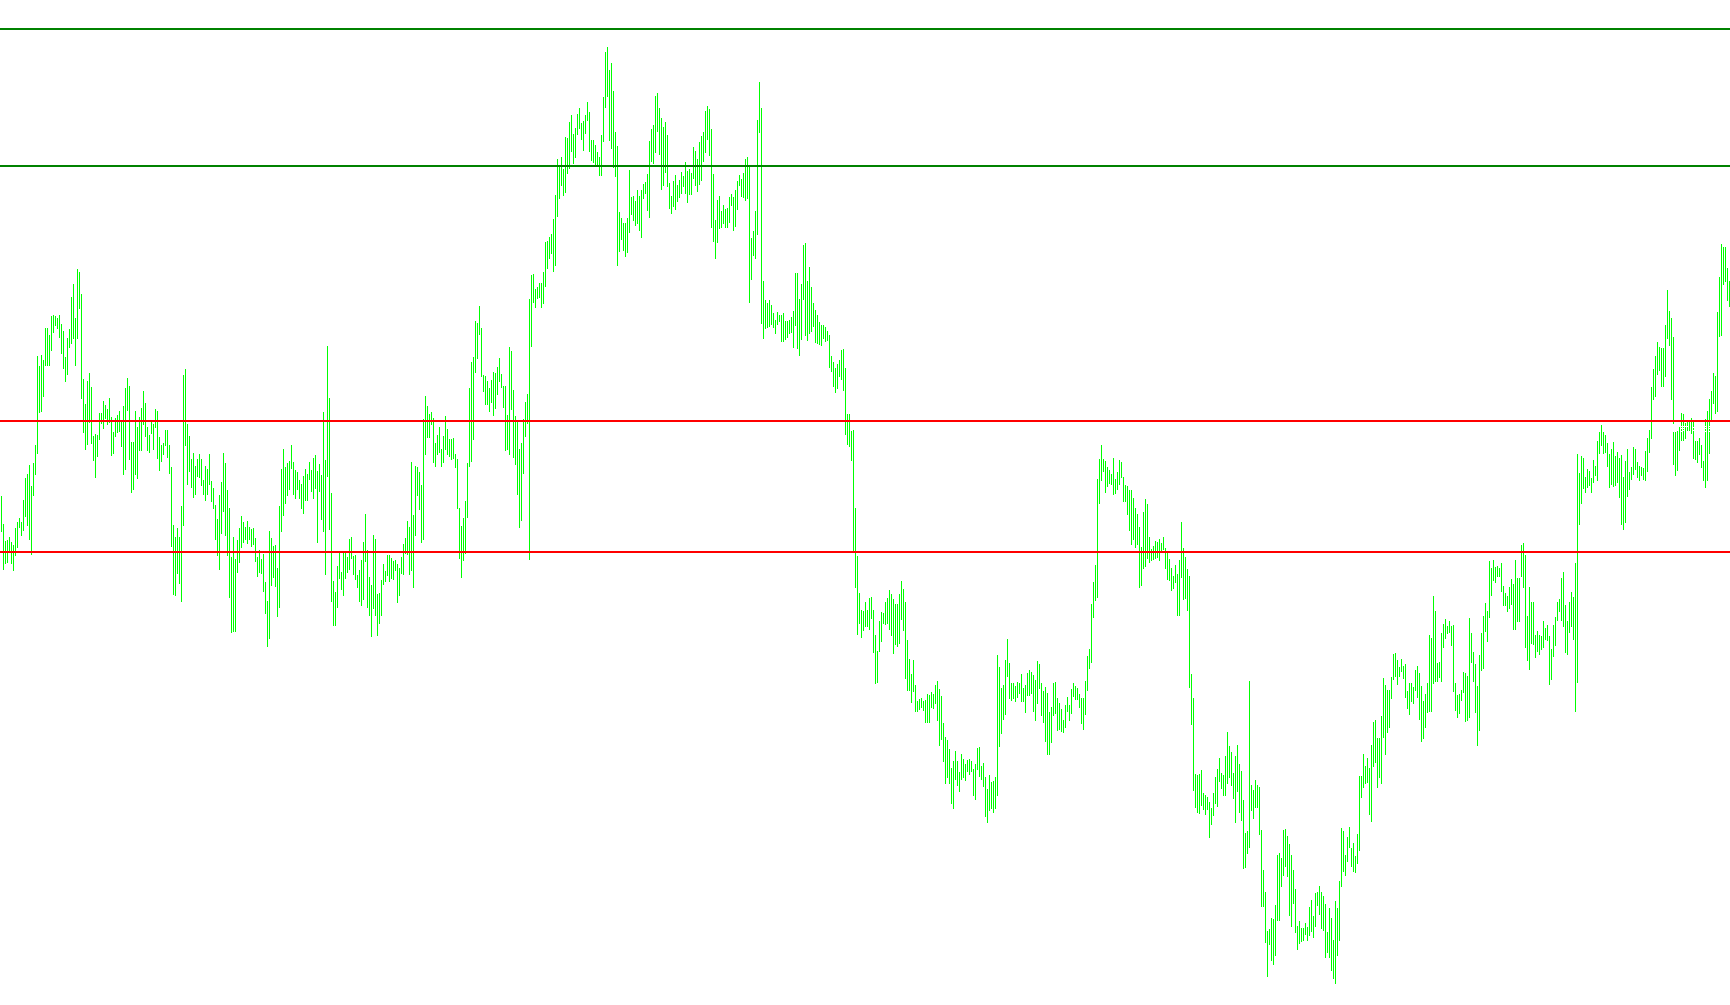
This tool is designed to provide traders with a clear visual representation of price boundaries and range movements on a trading chart. It focuses on identifying key horizontal levels based on previous market activity and current day's performance to help simplify the identification of potential entry or exit points.
Core Functionality
The script automatically calculates and displays several specific data points:
- Range Analysis: It calculates the "Range" (the distance between the highest and lowest price) for both the previous period and the current trading day. This allows traders to see at a glance how much volatility or price movement has occurred in those respective timeframes.
- Dynamic Price Levels: The tool identifies specific "High" and "Low" price points from the previous period and uses them to draw horizontal lines on your chart. These act as visual markers for historical peaks and troughs.
- Current Day Tracking: It monitors the live high and low prices of the current day, providing a real-time view of the active trading range.
Visual Features
To make this data easy to read during live trading, the script performs the following actions on your chart:
- Automatic Line Drawing: It draws horizontal lines representing the previous period's highs and lows. These lines are color-coded (Green for high levels and Red for low levels) to help distinguish between bullish and bearish boundaries quickly.
- Dynamic Labeling: Beside these lines, the script places text labels that describe exactly what each level represents, ensuring you don't have to guess which price point is being highlighted.
- On-Screen Dashboard: If enabled in the settings, the script provides a text comment directly on your chart. This acts as a quick summary dashboard showing the exact numerical range for both "Yesterday" and "Today," along with a specific trading instruction regarding whether the previous day's range met a certain size requirement.
How It Helps the Trader
By automating the calculation of these highs, lows, and ranges, the tool removes the manual effort of searching through historical candles to find significant price levels. It organizes the chart into a structured layout where the most important "breakout" or "rejection" zones are clearly visible, allowing for more disciplined decision-making based on price action.
//double Range = 0;
//Range = (period_High - period_Low) * Point


//+------------------------------------------------------------------+
//|                                                        Lines_HiLo.mq4 |
//|
//|
//+------------------------------------------------------------------+
#property copyright "TradeForex or anyone who is willing to improve this indicator, willing to develop a working Cash Cow EA - Is it already there?"
#property link      ""

#property indicator_chart_window


//extern int Lookback_Period = 4;


extern bool ViewComment = true;
double period_Low=0;
double period_High=0;
double Todays_High = 0;
double Todays_Low =  0;

double Yester_High_Line=0;
double Yester_Low_Line=0;
double Yesters_High=0;
double Yesters_Low=0;

double Todays_High_Line=0;
double Todays_Low_Line=0;
double Today_High_=0;
double Today_Low=0;

//double Range = 0;


double Yesterdays_Range = 0;
double Todays_Range = 0;


//+------------------------------------------------------------------+
//| Custom indicator initialization function                         |
//+------------------------------------------------------------------+
int init()
{


}


//+------------------------------------------------------------------+
//| Custor indicator deinitialization function                       |
//+------------------------------------------------------------------+
int deinit()
{
   ObjectDelete("Yesters_High Label");
   ObjectDelete("Yesters_High  Line");
   ObjectDelete("Yesters_Low Label");
   ObjectDelete("Yesters_Low Line");
   ObjectDelete("Today_High Label");
   ObjectDelete("Today_High  Line");
   ObjectDelete("Today_Low Label");
   ObjectDelete("Today_Low Line");


   return(0);
}

//+------------------------------------------------------------------+
//| Custom indicator iteration function                              |
//+------------------------------------------------------------------+
int start()
{

         period_High =High[Highest(NULL,0,MODE_HIGH,1,1)];
         period_Low =Low[Lowest(NULL,0,MODE_LOW,1,1)];

         Todays_High = iHigh(NULL,0,0);
         Todays_Low = iLow(NULL,0,0);
         Yester_High_Line =  (period_High + 0.0030);
         Yester_Low_Line =  (period_Low - 0.0030  );
         Yesterdays_Range = (period_High - period_Low)/Point ;
         Todays_Range = (Todays_High - Todays_Low)/Point;


        Todays_High_Line =  (Todays_Low + 0.0070 );
        Todays_Low_Line =  (Todays_High - 0.0070 );

   if (ViewComment==true){

   Comment("Yesterdays Range = ",    Yesterdays_Range  ,", ", "Todays Range = ",Todays_Range,",  ", "TRADE IF YESTRERDAY'S RANGE > 140");
   //Comment ("Buy at Higher of = ",    Todays_High  ,"or  ", Todays_Low);
      }


   {
      SetLevel("Buy at  cross of Higher Green", Yester_High_Line, Green); //Green
      SetLevel("Sell at break of lower Red", Yester_Low_Line, Red); //Red
     SetLevel("Buy at cross of Higher  Green", Todays_High_Line, Green); //Green
    SetLevel("Sell at cross of lower  Red", Todays_Low_Line, Red); //Red


   }


   return(0);
}


//+------------------------------------------------------------------+
//| Helper                                                           |
//+------------------------------------------------------------------+
void SetLevel(string text, double level, color col1)
{
   string labelname= text + " Label";
   string linename= text + " Line";

   if (ObjectFind(labelname) != 0) {
      ObjectCreate(labelname, OBJ_TEXT, 0, Time[5], level);
      ObjectSetText(labelname, " " + text, 8, "Arial", White);
   }
   else {
      ObjectMove(labelname, 0, Time[5], level);
   }

   if (ObjectFind(linename) != 0) {
      ObjectCreate(linename, OBJ_HLINE, 0, Time[20], level);
      ObjectSet(linename, OBJPROP_STYLE, STYLE_SOLID);
      ObjectSet(linename, OBJPROP_WIDTH, 2);
      ObjectSet(linename, OBJPROP_COLOR, col1);

      }
   else {
      ObjectMove(linename, 0, Time[20], level);

   }
}
Comments