Lines HiLo_ Periodical
Download script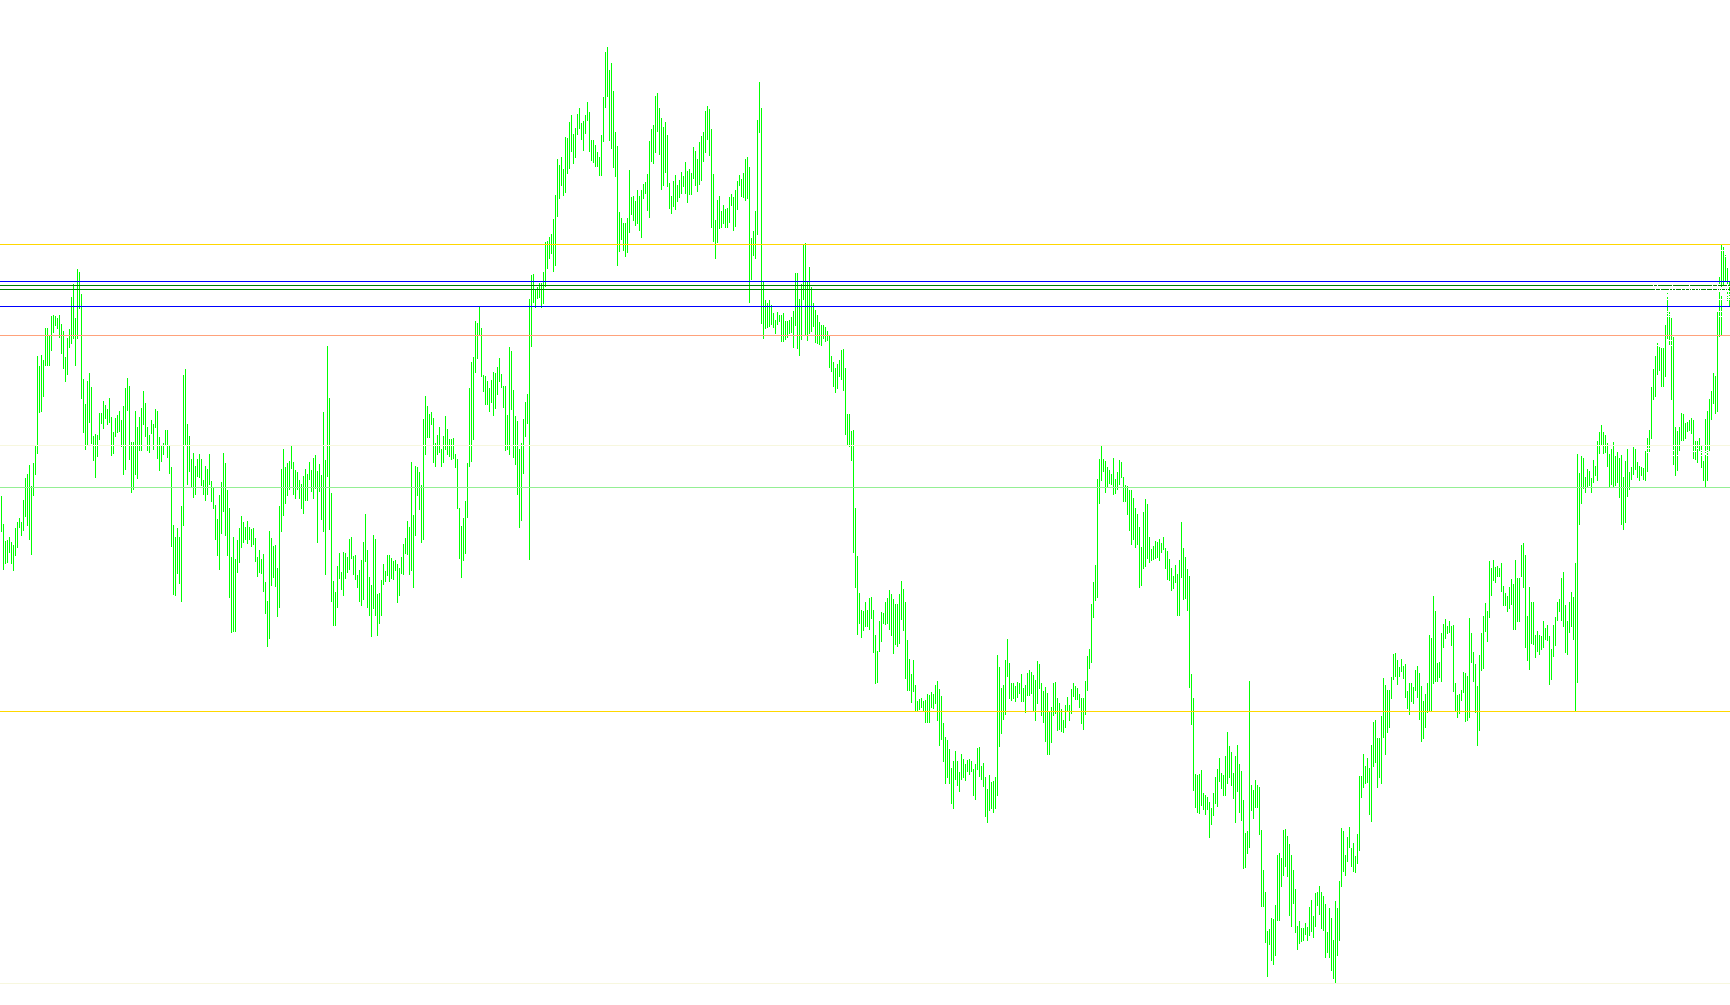
This script is designed to automatically identify and display key price milestones on your trading chart by calculating the highest and lowest prices reached over specific timeframes. Instead of you having to manually hunt for these price levels, the tool scans historical data to draw horizontal lines that represent significant boundaries.
Core Functionality
The logic operates by scanning the market history to find "Highs" and "Lows" based on three primary dimensions of time:
- Daily Boundaries: It identifies the highest and lowest points reached during the previous trading day.
- Weekly Boundaries: It tracks both the current week's progress (how high or low the price has gone so far) and the fixed boundaries of the previous week.
- Monthly & Yearly Boundaries: It captures the extremes for the current month and year, while also identifying the boundaries from the preceding month and year.
How it Works on Your Chart
Every time the market updates, the script performs the following actions:
- Data Scanning: It looks back at a specific number of days (defined in the settings) to find the maximum price point and the minimum price point for each period (Day, Week, Month, Year).
- Dynamic Updating: As new prices are made during the current week, month, or year, the script automatically adjusts the "Current" lines to reflect these new highs and lows in real-time.
- Visual Labeling: The script creates clear text labels on your chart (e.g., "Current Week High") so you can instantly identify what each line represents without guesswork.
- Color Coding: To make the chart easy to read at a glance, it assigns distinct colors to different timeframes:
- Salmon/Light Salmon: Weekly levels
- Green/Light Green: Monthly levels
- Gold/Beige: Yearly levels
- Blue: Previous day's levels
Practical Use for Traders
By visualizing these levels, the tool helps traders see "Support" and "Resistance" zones more clearly. It allows you to see where the price has historically struggled to break through or where it has previously reversed, providing a cleaner, more organized view of the market structure.
//+------------------------------------------------------------------+
//|                                                        Lines_HiLo_Periodical.mq4 |
//|
//|
//+------------------------------------------------------------------+
#property copyright "TradeForex"
#property link      ""

#property indicator_chart_window


//extern int Lookback_Period = 1
extern int Days_into_Curr_Week = 1;
extern int Days_into_Curr_Mnth = 1;
extern int Days_into_Curr_Year = 109;
extern int _Days_into_Curr_Year_To_May31_ = 109;
extern int No_of_Days_in_Prev_Wk = 5;
extern int Days_in_Prev_Month = 23;
extern int Days_in_Prev_Year = 245;


//int DayOfYear();
//double Curr_Yr_Daily_Bars_To_Today = 0;


double Daily_Period_Low=0;
double Daily_Period_High=0;
double Daily_Period_Low_Line;
double Daily_Period_High_Line;


double Curr_Wk_Period_High = 0;
double Curr_Wk_Period_Low = 0;
double Prev_Wk_Period_High = 0;
double Prev_Wk_Period_Low = 0;

double Curr_Wk_Period_High_Line;
double Curr_Wk_Period_Low_Line;

double Prev_Wk_Period_High_Line;
double Prev_Wk_Period_Low_Line;


double Curr_Month_Period_Low=0;
double Curr_Month_Period_High=0;
double Curr_Month_Period_Low_Line;
double Curr_Month_Period_High_Line;

double Prev_Month_Period_Low=0;
double Prev_Month_Period_High=0;
double Prev_Month_Period_Low_Line;
double Prev_Month_Period_High_Line;

double Curr_Year_Period_Low=0;
double Curr_Year_Period_High=0;
double Curr_Year_Period_Low_Line;
double Curr_Year_Period_High_Line;

double Prev_Year_Period_Low=0;
double Prev_Year_Period_High=0;
double Prev_Year_Period_Low_Line;
double Prev_Year_Period_High_Line;


//+------------------------------------------------------------------+
//| Custom indicator initialization function                         |
//+------------------------------------------------------------------+


int init()
  {


   return(0);
  }

//+------------------------------------------------------------------+
//| Custor indicator deinitialization function                       |
//+------------------------------------------------------------------+
int deinit()
{
        return(0);
}
//+------------------------------------------------------------------+
//| Custom indicator iteration function                              |
//+------------------------------------------------------------------+
int start()
{


        Daily_Period_High =High[Highest(NULL,0,MODE_HIGH,1,1)];
        Daily_Period_Low =Low[Lowest(NULL,0,MODE_LOW,1,1)];
        Daily_Period_Low_Line =  (Daily_Period_Low );
        Daily_Period_High_Line =  (Daily_Period_High );

        Curr_Wk_Period_High =High[Highest(NULL,0,MODE_HIGH,Days_into_Curr_Week,0 )];
        Curr_Wk_Period_Low =Low[Lowest(NULL,0,MODE_LOW,Days_into_Curr_Week,0 )];

        Prev_Wk_Period_High =High[Highest(NULL,0,MODE_HIGH,No_of_Days_in_Prev_Wk,Days_into_Curr_Week)];
        Prev_Wk_Period_Low =Low[Lowest(NULL,0,MODE_LOW,No_of_Days_in_Prev_Wk,Days_into_Curr_Week)];


        Curr_Wk_Period_High_Line =  (Curr_Wk_Period_High );
        Curr_Wk_Period_Low_Line =  (Curr_Wk_Period_Low );

        Prev_Wk_Period_High_Line =  (Prev_Wk_Period_High );
        Prev_Wk_Period_Low_Line =  (Prev_Wk_Period_Low );

        Curr_Month_Period_High =High[Highest(NULL,0,MODE_HIGH,Days_into_Curr_Mnth,0)];
        Curr_Month_Period_Low =Low[Lowest(NULL,0,MODE_LOW,Days_into_Curr_Mnth,0)];
        Curr_Month_Period_Low_Line =  (Curr_Month_Period_Low );
        Curr_Month_Period_High_Line =  (Curr_Month_Period_High );

        Prev_Month_Period_High =High[Highest(NULL,0,MODE_HIGH,Days_in_Prev_Month,Days_into_Curr_Mnth)];
        Prev_Month_Period_Low =Low[Lowest(NULL,0,MODE_LOW,Days_in_Prev_Month,Days_into_Curr_Mnth)];
        Prev_Month_Period_Low_Line =  (Prev_Month_Period_Low );
        Prev_Month_Period_High_Line =  (Prev_Month_Period_High );

        Curr_Year_Period_High =High[Highest(NULL,0,MODE_HIGH,Days_into_Curr_Year,0)];
        Curr_Year_Period_Low =Low[Lowest(NULL,0,MODE_LOW,Days_into_Curr_Year,0)];
        Curr_Year_Period_Low_Line =  (Curr_Year_Period_Low );
        Curr_Year_Period_High_Line =  (Curr_Year_Period_High );

        Prev_Year_Period_High =High[Highest(NULL,0,MODE_HIGH,Days_in_Prev_Year,Days_into_Curr_Year)];
        Prev_Year_Period_Low =Low[Lowest(NULL,0,MODE_LOW,Days_in_Prev_Year,Days_into_Curr_Year)];

        Prev_Year_Period_Low_Line =  (Prev_Year_Period_Low );
        Prev_Year_Period_High_Line =  (Prev_Year_Period_High );

   {


      SetLevel("Current Week High", Curr_Wk_Period_High_Line, Salmon); //Green
      SetLevel("Current Week Low", Curr_Wk_Period_Low_Line , Salmon); //G
      SetLevel("Previous Week High", Prev_Wk_Period_High_Line, LightSalmon); //Green
      SetLevel("Previous Week Low", Prev_Wk_Period_Low_Line, LightSalmon); //G

      SetLevel("Current Months High", Curr_Month_Period_High_Line, Green); //Green
      SetLevel("Current Months Low", Curr_Month_Period_Low_Line, Green); //G

      SetLevel("Previous Months High", Prev_Month_Period_High_Line, LightGreen); //Green
      SetLevel("Previous Months Low", Prev_Month_Period_Low_Line, LightGreen); //G

      SetLevel("Current Year High", Curr_Year_Period_High_Line, Gold); //Green
      SetLevel("Current Year Low", Curr_Year_Period_Low_Line, Gold); //G
      SetLevel("Previous Year High", Prev_Year_Period_High_Line, Beige); //Green
      SetLevel("Previous Year Low", Prev_Year_Period_Low_Line, Beige); //G

      SetLevel("Yesterdays High", Daily_Period_High_Line, Blue); //Blue
      SetLevel("Yesterdays Low", Daily_Period_Low_Line, Blue); //Blue

       }


   return(0);
}

void SetLevel(string text, double level, color col1)
{
   string labelname= text + " Label";
   string linename= text + " Line";

   if (ObjectFind(labelname) != 0) {
      ObjectCreate(labelname, OBJ_TEXT, 0, Time[20], level);
      ObjectSetText(labelname, " " + text, 8, "Arial", White);
   }
   else {
      ObjectMove(labelname, 0, Time[20], level);
   }

   if (ObjectFind(linename) != 0) {
      ObjectCreate(linename, OBJ_HLINE, 0, Time[40], level);
      ObjectSet(linename, OBJPROP_STYLE, STYLE_SOLID);
      ObjectSet(linename,OBJPROP_LEVELWIDTH, 5);
      ObjectSet(linename, OBJPROP_COLOR, col1);

      }
   else {
      ObjectMove(linename, 0, Time[40], level);

   }
}
Comments