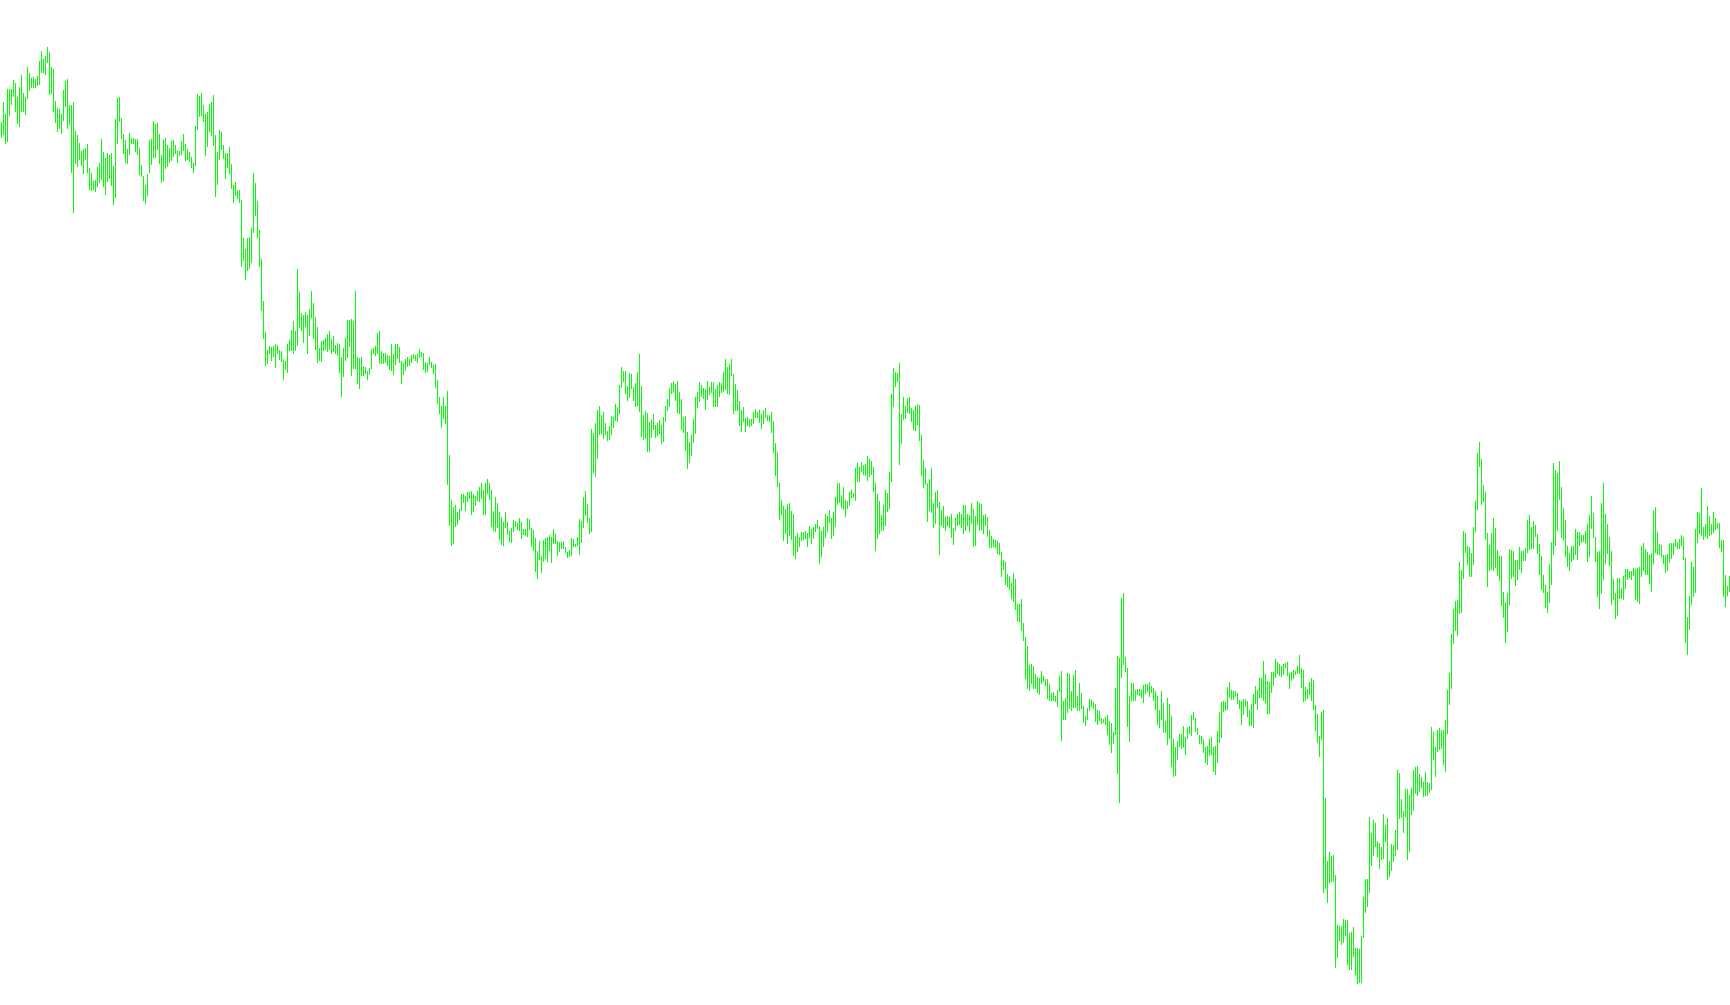
This tool is designed to provide a clear visual representation of price direction by comparing the current closing price of a financial asset against its previous opening price. It serves as a simplified trend indicator that helps traders quickly identify whether the market moved upward, downward, or remained stagnant during a specific timeframe.
How the Logic Works
The script operates by scanning every candle (time period) on your chart and performing a straightforward three-way comparison:
- Upward Movement: If the current price at the close of a candle is higher than the opening price of the preceding candle, the tool identifies this as positive movement.
- Downward Movement: If the current price at the close of a candle is lower than the opening price of the preceding candle, the tool recognizes this as negative movement.
- Neutral Movement: In the rare instance that the closing price is exactly equal to the previous opening price, the tool registers no specific direction.
Visual Representation
Instead of displaying complex numbers or cluttered data, the script translates these findings into a simplified numerical value plotted on your chart. By monitoring these shifts from one candle to the next, you can more easily visualize the momentum of the market and see at a glance whether the price is maintaining an upward trajectory or heading in a downward direction.
//+------------------------------------------------------------------+
//|    $OPEN                                                          |
//|                                                                  |
//|                                                                  |
//|   Copyright © 2008, Avery T. Horton, Jr. aka TheRumpledOne       |
//|                                                                  |
//|   PO BOX 43575, TUCSON, AZ 85733                                 |
//|                                                                  |
//|   GIFT AND DONATIONS ACCEPTED                                    |
//|                                                                  |
//|   therumpldone@gmail.com                                         |
//+------------------------------------------------------------------+
//|                                                                  |
//| go to www.kreslik.com for the latest indicator updates           |
//+------------------------------------------------------------------+
//|                                                                  |
//| Use www.efxgroup.com as your forex broker...                     |
//| ...tell them therumpledone sent you!                             |
//+------------------------------------------------------------------+

#property copyright "Avery T. Horton, Jr. aka TheRumpledOne © 2008"

#property link      "www.kreslik.com"

#property indicator_chart_window

#property indicator_buffers 1
#property indicator_color1 White

//---- input parameters


//---- buffers

double _Value[];

//+------------------------------------------------------------------+
//| Custom indicator initialization function                         |
//+------------------------------------------------------------------+
int init()
  {
   IndicatorBuffers(1);
   SetIndexBuffer(0,_Value);
   SetIndexStyle(0,DRAW_LINE);
   return(0);
  }
//+------------------------------------------------------------------+
//| Custom indicator deinitialization function                       |
//+------------------------------------------------------------------+
int deinit()
  {
//----

//----
   return(0);
  }
//+------------------------------------------------------------------+
//| Custom indicator iteration function                              |
//+------------------------------------------------------------------+


int start()
  {

   int i, dayi, counted_bars = IndicatorCounted();
//---- check for possible errors
   if(counted_bars < 0)
       return(-1);
//---- last counted bar will be recounted
   if(counted_bars > 0)
       counted_bars--;
   int limit = Bars - counted_bars;
//----
   for(i = limit - 1; i >= 0; i--)
     {

double _Result =  Open[i+1]  ;


    if ( Close[i] > _Result   ) _Value[i] = 1;
    else {
    if ( Close[i] < _Result  )  _Value[i] = -1;
    else  _Value[i] = 0;  }

}

//----
   return( 0 );
  }
//+------------------------------------------------------------------+
Comments