LSMA_ind_05
Download script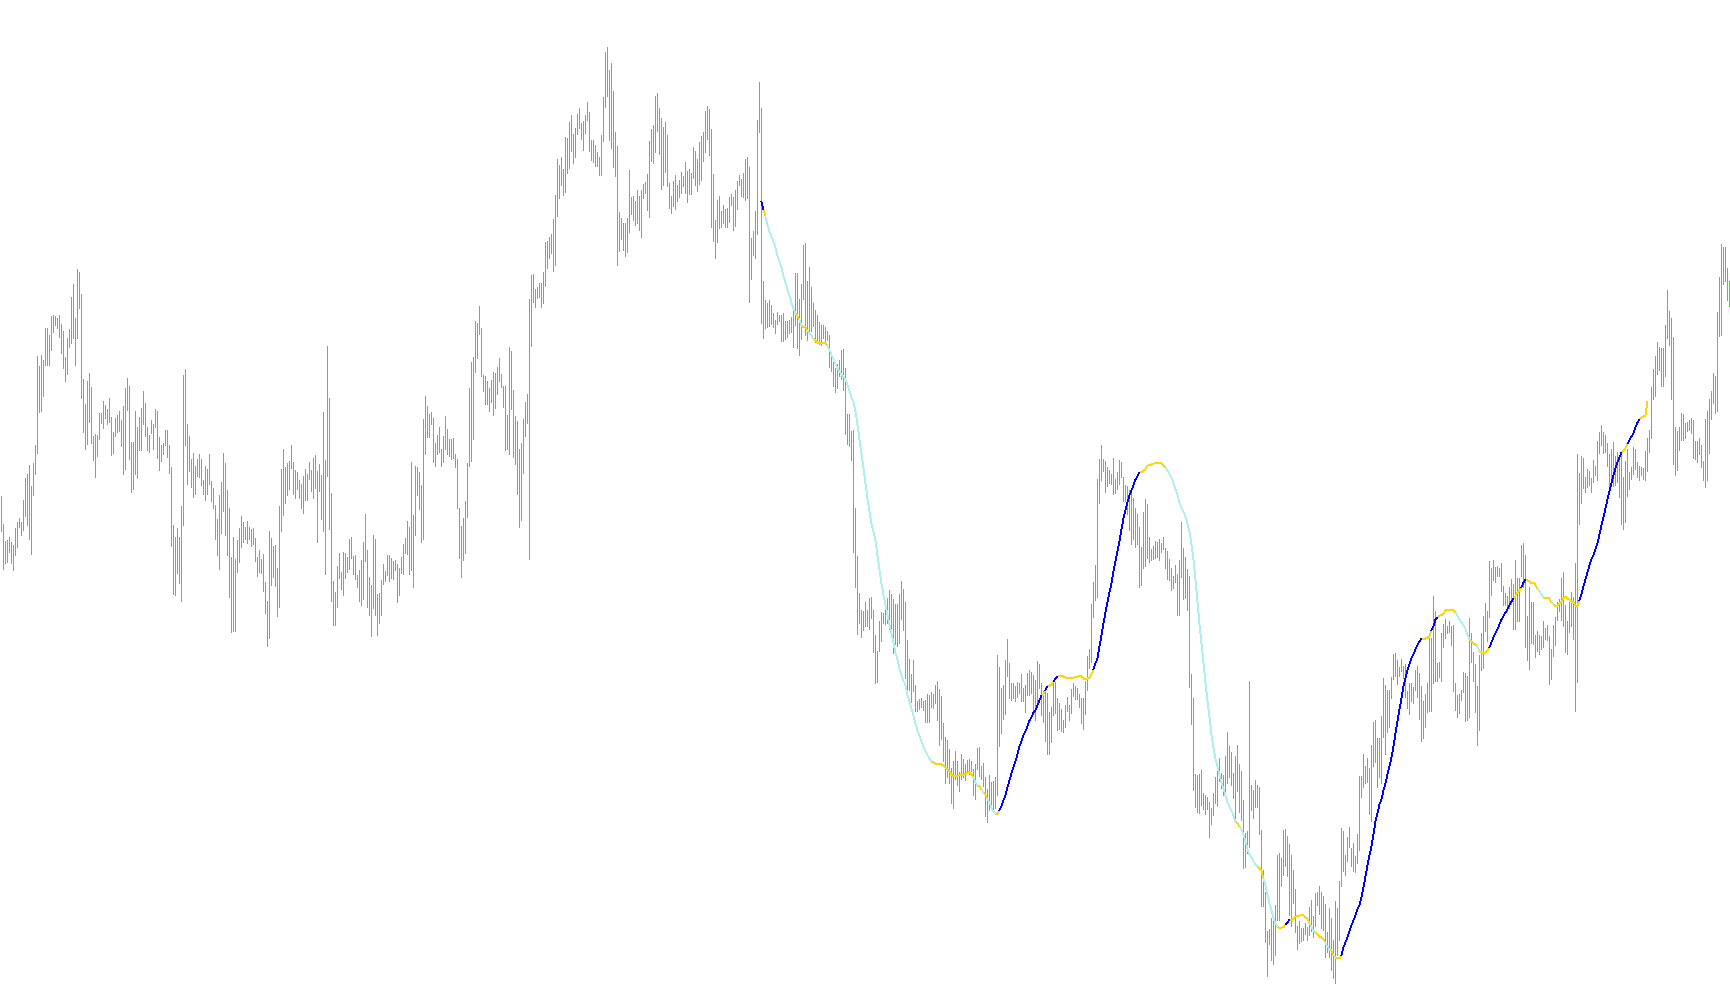
This technical indicator is designed to provide a smoothed visual representation of price trends on your trading chart. By processing historical price data through a weighted calculation, it aims to filter out minor market "noise" and highlight the underlying momentum of the asset.
How the Logic Works
The core functionality of this script relies on three main components:
1. Weighted Trend Calculation
Unlike basic moving averages that treat every price point equally, this logic applies a specific weight to prices based on their position within a set period (defined by the Rperiod setting). This weighting system gives more significance to certain points in time, creating a smoother, more responsive trend line that reacts to market movement without being overly sensitive to every tiny fluctuation.
2. Trend Momentum Detection The script tracks the progression of the trend from one moment to the next by comparing the current calculated value against its previous value. By analyzing the "gap" or difference between these two points, the indicator determines whether the trend is moving upward, downward, or remaining neutral.
3. Dynamic Visual Filtering The script uses three distinct visual components (represented by colors) to communicate the market state:
- The Baseline: A primary line serves as the foundation for the current trend analysis.
- Momentum Indicators: The script dynamically hides and shows specific colored segments based on a "Difference" threshold.
- If the movement is strong enough in one direction, it validates that trend by maintaining a specific color.
- If the movement is too weak or reverses, the script automatically clears those visual markers (setting them to an "empty" state).
Summary for Traders
In practical terms, this tool acts as a visual filter. It looks at a specific window of historical prices and calculates a weighted path. By comparing where the trend was to where it is now, it identifies high-confidence movements. When the price action is stable or moving significantly in one direction, the indicator highlights that momentum; when the momentum fails to meet a specific intensity threshold, the visual markers disappear, helping you identify periods of consolidation or indecision.
//+------------------------------------------------------------------+
//| LSMA                                                             |
//+------------------------------------------------------------------+
#property  copyright "Copywrong 2005 RonT"
#property  link      "http://www.lightpatch.com/forex/"

//---- indicator settings
#property  indicator_chart_window

#property indicator_buffers   7
#property indicator_color1  Yellow
#property indicator_color2  Green
#property indicator_color3  Red


//---- buffers
double ExtMapBuffer1[];  //Yellow
double ExtMapBuffer2[];  //Green
double ExtMapBuffer3[];  //Red

extern int extRperiod = 57;
extern int extDiff    =  6;
extern int extDraw4HowLong = 500;

int bartime;

//+------------------------------------------------------------------+
//| Custom indicator initialization function                         |
//+------------------------------------------------------------------+
int init()
  {

   SetIndexBuffer(0,ExtMapBuffer1);   //Yellow
   SetIndexStyle(0, DRAW_LINE, STYLE_SOLID, 2);

   SetIndexBuffer(1,ExtMapBuffer2);  //Green
   SetIndexStyle(1, DRAW_LINE, STYLE_SOLID, 2);

   SetIndexBuffer(2,ExtMapBuffer3);  //Red
   SetIndexStyle(2, DRAW_LINE, STYLE_SOLID, 2);

  }

//+------------------------------------------------------------------+
//| Custor indicator deinitialization function                       |
//+------------------------------------------------------------------+
int deinit()
  {
   int i;
   for( i=0; i<Bars; i++ )
     {
      ExtMapBuffer1[i]=0;
      ExtMapBuffer2[i]=0;
      ExtMapBuffer3[i]=0;
     }
  }


int start()
  {


   int    c;
   int    i;

   int    length;
   double lengthvar;
   int    loopbegin;

   int    pos;
   double sum;
   double tmp;

   double wtp; //previous value
   double wt;  //current value

   int DiffADJ=extDiff;

   if(bartime==Time[0]) return(0);
   bartime=Time[0];


   length = extRperiod;
   loopbegin = extDraw4HowLong - length - 1;

   for(pos = loopbegin; pos >= 0; pos--)
     {

      sum = 0;
      for(i = length; i >= 1  ; i--)
        {
         lengthvar = length + 1;
         lengthvar /= 3;
         tmp = 0;
         tmp = ( i - lengthvar)*Open[length-i+pos];
         sum+=tmp;
        }

      wtp=wt;
      wt = sum*6/(length*(length+1));

      ExtMapBuffer1[pos] = wt+(10*Point);   //yellow
      ExtMapBuffer2[pos] = wt+(10*Point);   //green
      ExtMapBuffer3[pos] = wt+(10*Point);   //red

      if (wtp < wt+(DiffADJ*Point))
        {
         ExtMapBuffer3[pos] = EMPTY_VALUE; //remove RED
         //DiffADJ=0;
        }

      if (wtp > wt-(DiffADJ*Point))
        {
         ExtMapBuffer2[pos] = EMPTY_VALUE; //remove GREEN
         //DiffADJ=0;
        }

     if (wtp>wt+(DiffADJ*Point) && wtp<wt-(DiffADJ*Point))
       {
        //DiffADJ=extDiff;
       }

     }

  }
Comments