LSMA_ind_02
Download script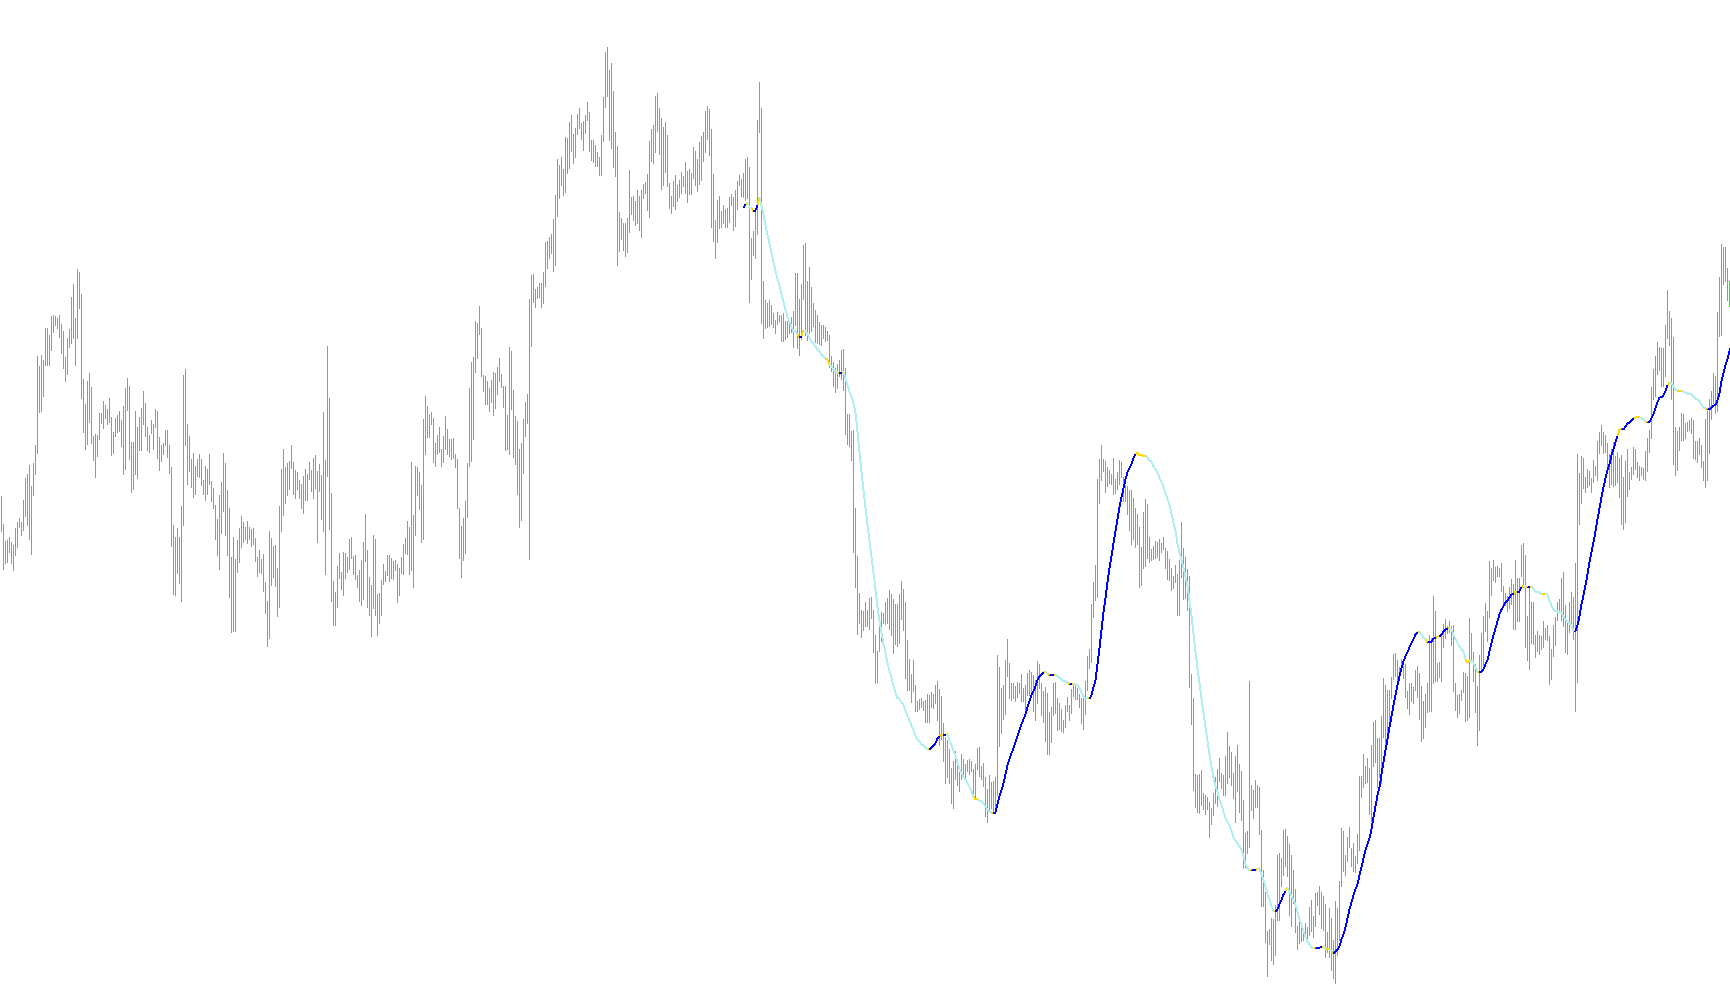
This technical indicator is designed to provide visual clarity on financial charts by smoothing out price fluctuations and identifying the underlying momentum of the market. It functions as a dynamic trend-following tool that helps traders distinguish between significant price movements and minor "noise."
Core Functionality
The primary logic of the script relies on a mathematical weighting system. Rather than looking at just the most recent price, the indicator analyzes a specific range of historical data (defined by the user-set period) to calculate a moving average.
What makes this specific logic unique is that it applies a weighted distribution to these prices. It calculates a cumulative sum where the importance of each price point is factored into the final result based on its position within the lookback period. This ensures that the resulting line is not just a simple average, but a weighted representation of price momentum.
Visual Logic and Signal Generation
The indicator translates these complex calculations into four distinct visual components on your trading platform:
- Trend Tracking: The script generates three different colored lines (Yellow, Green, and Red). These act as the visual foundation for the current market trend.
- Dynamic Switching: The logic includes a conditional "switch" mechanism. By comparing the current calculated value against the previous value, the script determines if the momentum is moving upward or downward.
- Color Filtering: Depending on whether the price trend is rising or falling, the script dynamically suppresses certain colors. This creates a cleaner visual experience where only the relevant trend color remains visible at any given time, helping the trader focus on the current direction of the market.
- Signal Markers: The indicator also includes a dedicated buffer for specific symbols (dots/squares). These serve as specific markers to highlight key data points identified by the calculation logic.
Summary for Traders
In practical terms, this script acts as a sophisticated smoothing filter. It processes historical price data through a weighted formula to determine the "true" path of the market. By automatically changing colors and hiding irrelevant data based on momentum shifts, it allows you to see whether the market is trending up or down with much greater clarity than a standard moving average would provide.
/*-----------------------------+
|			       |
| Shared by www.Aptrafx.com    |
|			       |
+------------------------------*/

//+------------------------------------------------------------------+
//|                                                        |
//|                      Copyright © 2004, MetaQuotes Software Corp. |
//|                                       http://www.metaquotes.net/ |
//+------------------------------------------------------------------+
#property  copyright "Copyright © 2005, FX Sniper "
#property  link      "http://www.metaquotes.net/"

//---- indicator settings
#property  indicator_chart_window

#property indicator_buffers   4
#property indicator_color1  Yellow
#property indicator_color2  Green
#property indicator_color3  Red
#property indicator_color4  White

//---- buffers
double ExtMapBuffer1[];  //Yellow
double ExtMapBuffer2[];  //Green
double ExtMapBuffer3[];  //Red
double XBuffer[];        //White

extern int extRperiod = 48;
extern int extDraw4HowLong = 500;

//----- variables
int    c;
int    i;
int    length;
double lengthvar;
int    loopbegin;
int    pos;
double sum;
double tmp;
int    width;

double wtp; //previous value
double wt;  //current value


//+------------------------------------------------------------------+
//| Custom indicator initialization function                         |
//+------------------------------------------------------------------+
int init()
  {

   SetIndexBuffer(0,ExtMapBuffer1);   //Yellow
   SetIndexStyle(0, DRAW_LINE, STYLE_SOLID, 2);

   SetIndexBuffer(1,ExtMapBuffer2);  //Green
   SetIndexStyle(1, DRAW_LINE, STYLE_SOLID, 2);

   SetIndexBuffer(2,ExtMapBuffer3);  //Red
   SetIndexStyle(2, DRAW_LINE, STYLE_SOLID, 2);


   // 233 up arrow
   // 234 down arrow
   // 159 big dot
   // 168 open square
   // 120 box with X
   SetIndexStyle(3,DRAW_ARROW);
   SetIndexBuffer(3, XBuffer);     //White
   SetIndexArrow(3,159);

   return(0);
  }

//+------------------------------------------------------------------+
//| Custor indicator deinitialization function                       |
//+------------------------------------------------------------------+
int deinit()
  {
   int i;

   for( i=0; i<Bars; i++ ) ExtMapBuffer1[i]=0;
   for( i=0; i<Bars; i++ ) ExtMapBuffer2[i]=0;
   for( i=0; i<Bars; i++ ) ExtMapBuffer3[i]=0;
   for( i=0; i<Bars; i++ ) XBuffer[i]=0;

   return(0);
  }


int start()
  {
   length = extRperiod;
   loopbegin = extDraw4HowLong - length - 1;

   for(pos = loopbegin; pos >= 0; pos--)
     {
      sum = 0;
      for(i = length; i >= 1  ; i--)
        {
         lengthvar = length + 1;
         lengthvar /= 3;
         tmp = 0;
         tmp = ( i - lengthvar)*Close[length-i+pos];
         sum+=tmp;
        }

      wtp=wt;
      wt = sum*6/(length*(length+1));

      ExtMapBuffer1[pos] = wt;   //yellow
      ExtMapBuffer2[pos] = wt;   //green
      ExtMapBuffer3[pos] = wt;   //red

      if (wtp > wt)
        {
         ExtMapBuffer2[pos+1] = EMPTY_VALUE; // remove the GREEN
        }
      else
        {
         ExtMapBuffer3[pos+1] = EMPTY_VALUE; // remove the RED
        }
      }

   return(0);
  }
//+------------------------------------------------------------------+
Comments