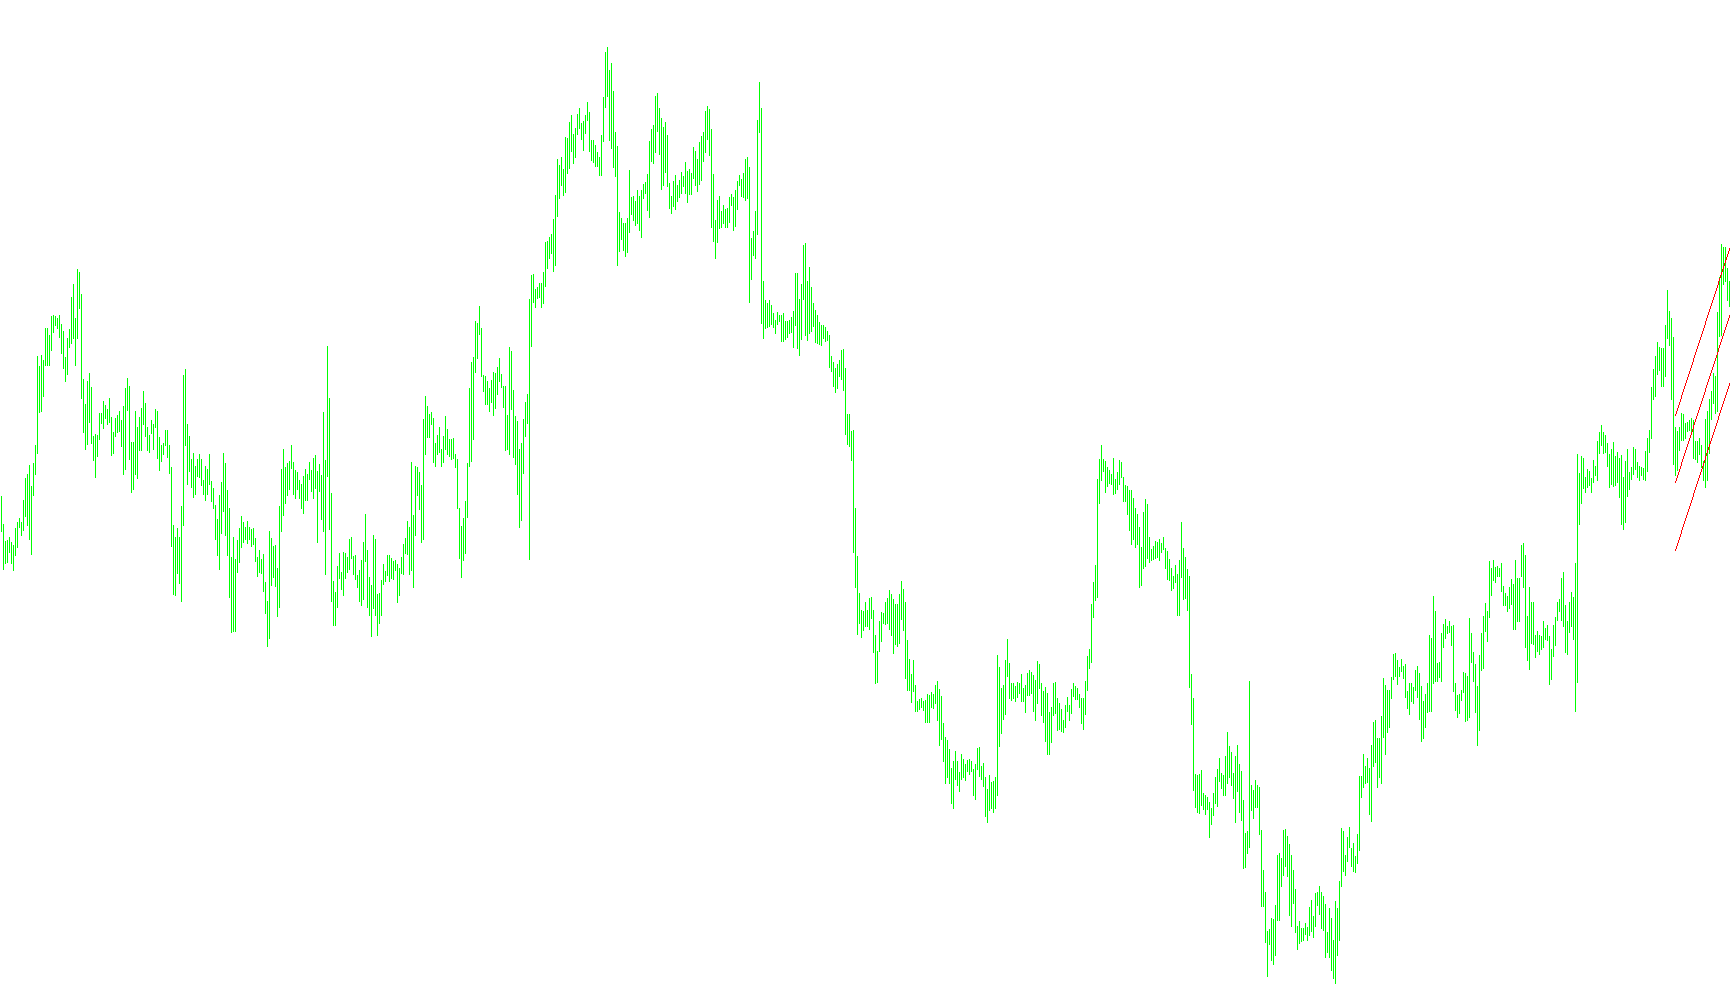
This script functions as a technical analysis tool designed to visualize price trends and volatility on a trading chart. Rather than simply following the most recent price movements, it uses a mathematical approach called linear regression to determine the "fair value" trajectory of an asset over a specific period.
Core Functionality
The tool automatically calculates and draws three distinct lines on your chart: a central trend line and two outer boundary lines (upper and lower). Here is how the logic works step-by-step:
1. Data Selection and Periodicity The script begins by looking at a user-defined window of past data (the "Period"). You can choose whether the calculation should be based on the closing prices, the highest prices, or the lowest prices of the candles within that timeframe.
2. The Central Trend Line (Regression) Instead of drawing a line from point A to point B, the script performs a mathematical regression. It analyzes every price point within the chosen period to calculate a "line of best fit." This line represents the overall direction of the market, smoothing out minor fluctuations and noise to show you the primary trend.
3. Volatility and Deviation Analysis To determine how far away the price has strayed from the trend, the script calculates the standard deviation. This is a measure of volatility—essentially determining how much the price typically "wiggles" around the central trend line.
4. The Channel Boundaries (Upper and Lower Lines) Using the standard deviation mentioned above, the script projects two outer boundaries:
- The Upper Line: Calculated by adding a specific multiplier of the deviation to the central trend.
- The Lower Line: Calculated by subtracting that same multiplier from the central trend.
Practical Application
By combining these three components, the script creates an "Auto Regression Channel." This allows traders to see:
- The Direction: The middle line shows the underlying momentum of the market.
- The Range: The space between the upper and lower lines represents the normal "breathing room" of the price.
When the price moves toward the outer boundaries, it indicates that the asset is reaching a point of high deviation from its average trend, which can help identify potential overbought or oversold conditions relative to the current regression path.
/*-----------------------------+
|			       |
| Shared by www.Aptrafx.com    |
|			       |
+------------------------------*/

//+------------------------------------------------------------------+
//|                                                    LSMA_Line.mq4 |
//|                      Copyright © 2005, MetaQuotes Software Corp. |
//|                                       http://www.metaquotes.net/ |
//+------------------------------------------------------------------+
#property copyright "Copyright © 2005, MetaQuotes Software Corp."
#property link      "http://www.metaquotes.net/"

#property indicator_chart_window
//---- indicator parameters
extern int    IdNum   = 1;
extern int    RPeriod = 28;
extern color  LineColor = Red;
extern int    LineWeight   = 1;
extern int    PriceVal = 0;         // 0 = Close, 1 = Low, 2 = High
extern double StDev = 1.618;

//+------------------------------------------------------------------+
//| Custom indicator initialization function                         |
//+------------------------------------------------------------------+
int init()
  {
//----
  ObjectCreate("Reg_line"+IdNum, OBJ_TREND, 0, 0,0, 0,0);
	ObjectSet("Reg_line"+IdNum, OBJPROP_COLOR, LineColor);
 	ObjectSet("Reg_line"+IdNum, OBJPROP_STYLE, STYLE_SOLID);
 	ObjectSet("Reg_line"+IdNum, OBJPROP_WIDTH, LineWeight);
  ObjectCreate("Reg_upper" +IdNum, OBJ_TREND, 0, 0,0, 0,0);
	ObjectSet("Reg_upper"+IdNum, OBJPROP_COLOR, LineColor);
 	ObjectSet("Reg_upper"+IdNum, OBJPROP_STYLE, STYLE_SOLID);
 	ObjectSet("Reg_upper"+IdNum, OBJPROP_WIDTH, LineWeight);
  ObjectCreate("Reg_lower" +IdNum, OBJ_TREND, 0, 0,0, 0,0);
 	ObjectSet("Reg_lower"+IdNum, OBJPROP_COLOR, LineColor);
 	ObjectSet("Reg_lower"+IdNum, OBJPROP_STYLE, STYLE_SOLID);
 	ObjectSet("Reg_lower"+IdNum, OBJPROP_WIDTH, LineWeight);

  Comment("Auto Regression channel");
   return(0);
  }

//+------------------------------------------------------------------+
//| Custor indicator deinitialization function                       |
//+------------------------------------------------------------------+
void deinit() {
  ObjectDelete("Reg_line"+IdNum);
  ObjectDelete("Reg_upper" +IdNum);
  ObjectDelete("Reg_lower" +IdNum);
  Comment("");
}

//+------------------------------------------------------------------+
//| Regression Line                                                  |
//+------------------------------------------------------------------+
int start()
  {
   double y1,y2, price;
   double a1, a2, a3, b1, a, b;
   double stddiv, tmp_div;
   double x_n_up, x_1_up, x_n_down, x_1_down;
   int shift, n;

//----
   if(Bars<=RPeriod) return(0);
   a1 = 0;
   a2 = 0;
   a3 = 0;
   b1 = 0;
   a = 0;
   b = 0;
   y1 = 0;
   y2 = 0;
   tmp_div = 0;
   n = RPeriod;
  	for(shift=RPeriod;shift>0;shift--)
  	{
  	  switch (PriceVal)
  	  {
  	     case 0: price = Close[shift];
  	             break;
  	     case 1: price = Low[shift];
  	             break;
  	     case 2: price = High[shift];
  	             break;
  	  }
     a1 = a1 + shift*price;
     a2 = a2 + shift;
     a3 = a3 + price;
     b1 = b1 + shift*shift;
  }

  b = (n*a1 - a2*a3)/(n*b1 - a2*a2);
  a = (a3 - b*a2)/n;
  y1 = a + b*n;
  y2 = a + b;

 	ObjectSet("Reg_line"+IdNum, OBJPROP_TIME1, Time[RPeriod]);
 	ObjectSet("Reg_line"+IdNum, OBJPROP_TIME2, Time[0]);
 	ObjectSet("Reg_line"+IdNum, OBJPROP_PRICE1, y1);
 	ObjectSet("Reg_line"+IdNum, OBJPROP_PRICE2, y2);

  for (shift=RPeriod; shift>0; shift--) {
  	  switch (PriceVal)
  	  {
  	     case 0: price = Close[shift];
  	             break;
  	     case 1: price = Low[shift];
  	             break;
  	     case 2: price = High[shift];
  	             break;
  	  }

  	tmp_div = tmp_div + (price - (a + b*shift))*(price - (a + b*shift));
  }

  stddiv = MathSqrt(tmp_div/n);

  x_n_up = y1 + StDev*stddiv;
  x_1_up = y2 + StDev*stddiv;

  x_n_down = y1 - StDev*stddiv;
  x_1_down = y2 - StDev*stddiv;


  //upper
 	ObjectSet("Reg_upper"+IdNum, OBJPROP_TIME1, Time[RPeriod]);
 	ObjectSet("Reg_upper"+IdNum, OBJPROP_TIME2, Time[0]);
 	ObjectSet("Reg_upper"+IdNum, OBJPROP_PRICE1, x_n_up);
 	ObjectSet("Reg_upper"+IdNum, OBJPROP_PRICE2, x_1_up);
  //lower
 	ObjectSet("Reg_lower"+IdNum, OBJPROP_TIME1, Time[RPeriod]);
 	ObjectSet("Reg_lower"+IdNum, OBJPROP_TIME2, Time[0]);
 	ObjectSet("Reg_lower"+IdNum, OBJPROP_PRICE1, x_n_down);
 	ObjectSet("Reg_lower"+IdNum, OBJPROP_PRICE2, x_1_down);

   return(0);
  }
//+------------------------------------------------------------------+
Comments