Pivot Lines Timezone_v2
Download script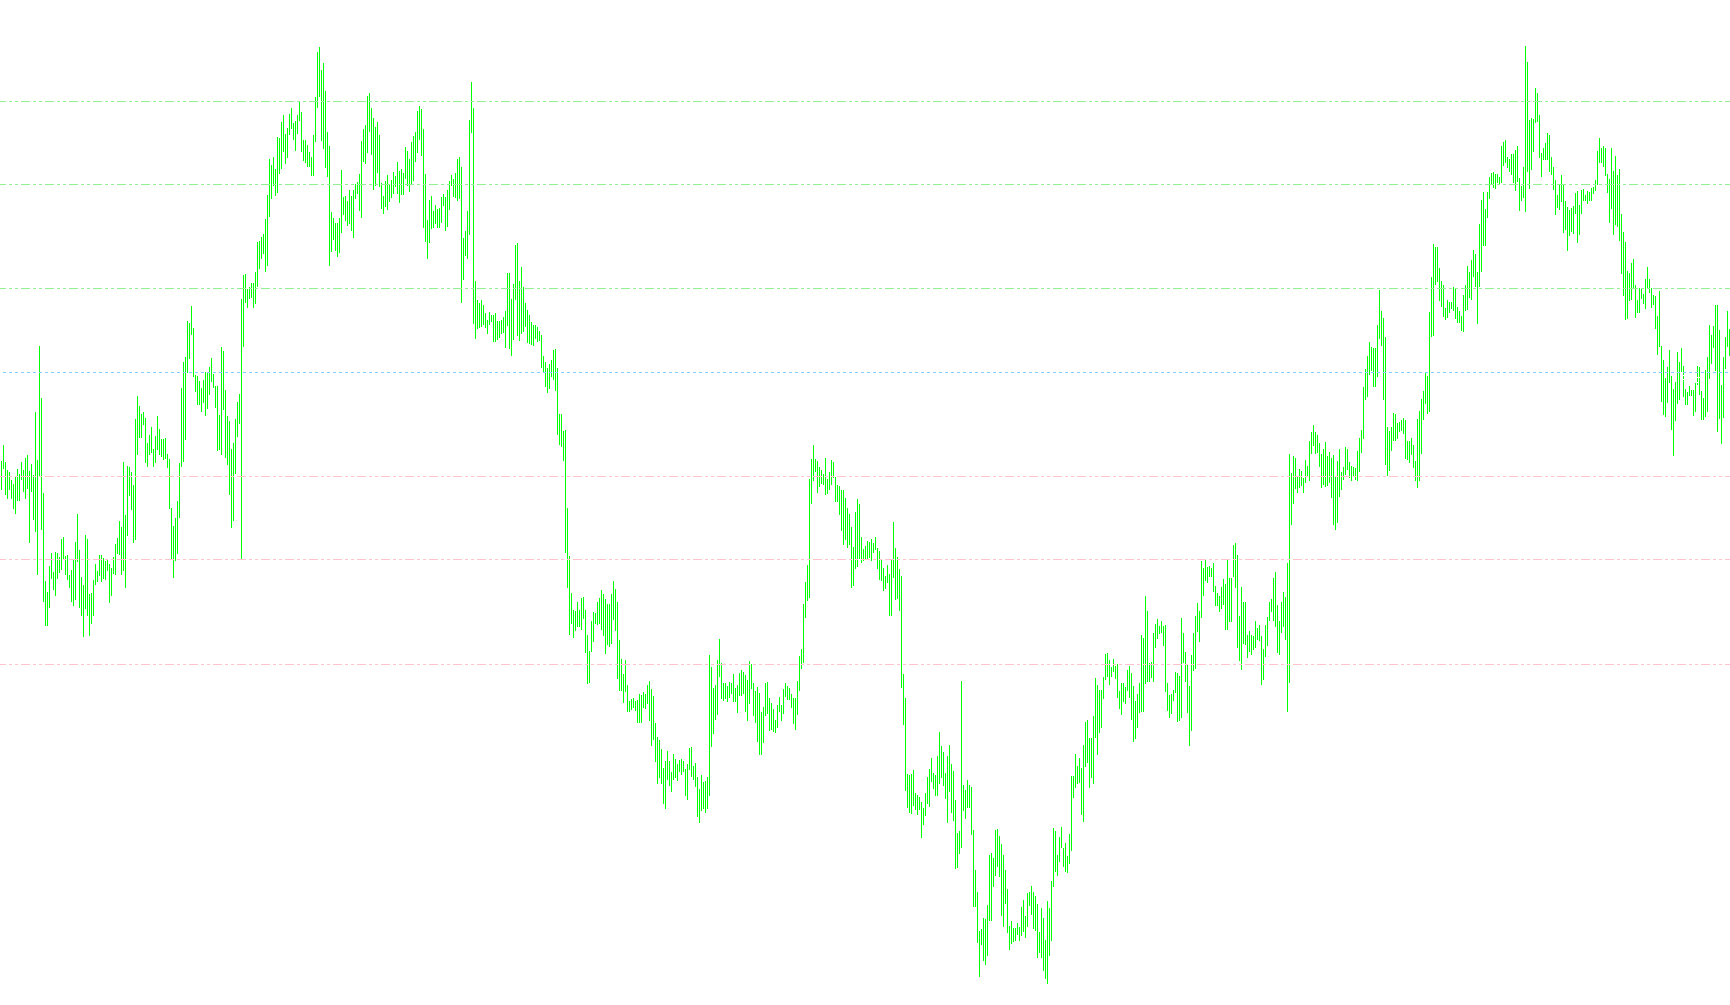
Overview of the Pivot Lines TimeZone Script
This tool is designed for traders who use technical analysis to identify key support and resistance levels on their trading charts. Its primary function is to automatically calculate and draw several types of "Pivot Points"—mathematical price markers that help traders anticipate where the market might change direction or consolidate.
How the Logic Works
The script operates by gathering historical price data from specific timeframes (Daily, Hourly, and Weekly) and performing a series of calculations based on those figures. Here is a breakdown of the internal logic:
1. Data Gathering and Time Awareness
The script first establishes a "time zone" awareness to ensure it identifies the correct "previous day" prices regardless of your local clock settings. It looks specifically at:
- Yesterday's High, Low, and Closing prices.
- Today's current High, Low, and Opening prices.
- The previous week's High and Low.
To ensure accuracy, the script includes a safety check: if you attempt to run it on a chart timeframe larger than one day (like a weekly or monthly chart), it will display an error message, as the logic is built specifically for intraday analysis.
2. Pivot Point Calculations
Once the data is collected, the script generates three distinct types of technical levels based on your preferences:
- Standard Pivots: It calculates a central "Pivot" point using the average of yesterday’s high, low, and close. From there, it projects multiple Resistance (R1, R2, R3) and Support (S1, S2, S3) levels. These are the classic markers used to see where price might struggle to break upward or downward.
- Camarilla Levels: This is an alternative set of calculations (H3, H4, L3, L4). Traders often use these specifically to identify potential breakout points for day trading.
- Midpoint Pivots: The script can calculate "sub-pivots" (M0 through M5). These act as finer markers between the main support and resistance lines, providing a more granular view of price action.
3. Visual Display
The script doesn't just do the math in the background; it physically draws these levels on your chart:
- Dynamic Labels: It places text labels (like "R1", "S1", etc.) next to the lines so you can easily identify them.
- Color Coding: Different types of lines are assigned unique colors (such as Pink for standard support, LightGreen for resistance, and Orange for Camarilla) to help you distinguish between different technical models at a glance.
- Yesterday's Range: You can choose to have the script highlight the high and low of the previous day as specific dashed lines, providing an immediate visual reference for the "trading range" established during the previous session.
Summary for the User
In simple terms, this script automates the "manual math" of technical analysis. Instead of you having to calculate where the support and resistance levels are based on yesterday's performance, the script identifies those values instantly and draws them on your screen, allowing you to focus entirely on executing your trading strategy.
//+-------------------------------------------------------------------+
//|                                          Pivot Lines TimeZone.mq4 |
//|                       Copyright © 2004, MetaQuotes Software Corp. |
//|                                         http://www.metaquotes.net |
//|                                Made/Modified by Alejandro Galindo |
//|                                                                   |
//+-------------------------------------------------------------------+
#property copyright "Copyright © 2004, MetaQuotes Software Corp."
#property link      "http://www.metaquotes.net"

#property indicator_chart_window

extern int TimeZone=2;
extern bool pivots = true;
extern bool camarilla = false;
extern bool midpivots = false;
extern bool yesterdayHighLow = false;

double day_high=0;
double day_low=0;
double yesterday_high=0;
double yesterday_open=0;
double yesterday_low=0;
double yesterday_close=0;
double today_open=0;
double today_high=0;
double today_low=0;
double weekly_high=0;
double weekly_low=0;
double P=0;
double Q=0;
double R1,R2,R3;
double M0,M1,M2,M3,M4,M5;
double S1,S2,S3;
double H4,H3,L4,L3;
double YH, YL;
double nQ=0;
double nD=0;
double D=0;
double rates_h1[2][6];
double rates_d1[2][6];
double rates_w1[2][6];

//+------------------------------------------------------------------+
//| Custom indicator initialization function                         |
//+------------------------------------------------------------------+
int init()
  {
//---- indicators
 R1=0; R2=0; R3=0;
 M0=0; M1=0; M2=0; M3=0; M4=0; M5=0;
 S1=0; S2=0; S3=0;
 H4=0; H3=0; L4=0; L3=0;
 YH=0; YL=0;

//----
   return(0);
  }
//+------------------------------------------------------------------+
//| Custor indicator deinitialization function                       |
//+------------------------------------------------------------------+
int deinit()
  {
//---- TODO: add your code here
ObjectDelete("R1 Label");
ObjectDelete("R1 Line");
ObjectDelete("R2 Label");
ObjectDelete("R2 Line");
ObjectDelete("R3 Label");
ObjectDelete("R3 Line");
ObjectDelete("S1 Label");
ObjectDelete("S1 Line");
ObjectDelete("S2 Label");
ObjectDelete("S2 Line");
ObjectDelete("S3 Label");
ObjectDelete("S3 Line");
ObjectDelete("P Label");
ObjectDelete("P Line");
ObjectDelete("H4 Label");
ObjectDelete("H4 Line");
ObjectDelete("H3 Label");
ObjectDelete("H3 Line");
ObjectDelete("L3 Label");
ObjectDelete("L3 Line");
ObjectDelete("L4 Label");
ObjectDelete("L4 Line");
ObjectDelete("M5 Label");
ObjectDelete("M5 Line");
ObjectDelete("M4 Label");
ObjectDelete("M4 Line");
ObjectDelete("M3 Label");
ObjectDelete("M3 Line");
ObjectDelete("M2 Label");
ObjectDelete("M2 Line");
ObjectDelete("M1 Label");
ObjectDelete("M1 Line");
ObjectDelete("M0 Label");
ObjectDelete("M0 Line");
ObjectDelete("YL Label");
ObjectDelete("YL Line");
ObjectDelete("YH Label");
ObjectDelete("YH Line");
//----
   return(0);
  }
//+------------------------------------------------------------------+
//| Custom indicator iteration function                              |
//+------------------------------------------------------------------+
int start()
  {
      int i=0, j=0;
//---- TODO: add your code here

//---- exit if period is greater than daily charts
if(Period() > 1440)
{
Print("Error - Chart period is greater than 1 day.");
return(-1); // then exit
}

//---- Get new daily prices

ArrayCopyRates(rates_d1, Symbol(), PERIOD_D1);

if (DayOfWeek()==1) {
   yesterday_close = rates_d1[2][4];
   yesterday_open = rates_d1[2][1];
   today_open = rates_d1[0][1];
   yesterday_high = rates_d1[2][3];
   yesterday_low = rates_d1[2][2];
   day_high = rates_d1[0][3];
   day_low = rates_d1[0][2];
   weekly_high = rates_w1[1][3];
   weekly_low = rates_w1[1][2];
} else {
   yesterday_close = rates_d1[1][4];
   yesterday_open = rates_d1[1][1];
   today_open = rates_d1[0][1];
   yesterday_high = rates_d1[1][3];
   yesterday_low = rates_d1[1][2];
   day_high = rates_d1[0][3];
   day_low = rates_d1[0][2];
   weekly_high = rates_w1[1][3];
   weekly_low = rates_w1[1][2];
}

ArrayCopyRates(rates_h1, Symbol(), PERIOD_H1);
for (i=0;i<=25;i++)
{
   if (TimeMinute(rates_h1[i][0])==0 && (TimeHour(rates_h1[i][0])-TimeZone)==0)
   {
      yesterday_close = rates_h1[i+1][4];
      yesterday_open = rates_h1[i+24][1];
      today_open = rates_h1[i][1];
      break;
   }
}

//---- Calculate Pivots

D = (day_high - day_low);
Q = (yesterday_high - yesterday_low);
P = (yesterday_high + yesterday_low + yesterday_close) / 3;
R1 = (2*P)-yesterday_low;
S1 = (2*P)-yesterday_high;
R2 = P+(yesterday_high - yesterday_low);
S2 = P-(yesterday_high - yesterday_low);
YH = yesterday_high;
YL = yesterday_low;

	H4 = (Q*0.55)+yesterday_close;
	H3 = (Q*0.27)+yesterday_close;
	R3 = (2*P)+(yesterday_high-(2*yesterday_low));
	M5 = (R2+R3)/2;
//	R2 = P-S1+R1;
	M4 = (R1+R2)/2;
//	R1 = (2*P)-yesterday_low;
	M3 = (P+R1)/2;
//	P = (yesterday_high + yesterday_low + yesterday_close)/3;
	M2 = (P+S1)/2;
//	S1 = (2*P)-yesterday_high;
	M1 = (S1+S2)/2;
//	S2 = P-R1+S1;
	S3 = (2*P)-((2* yesterday_high)-yesterday_low);
	L3 = yesterday_close-(Q*0.27);
	L4 = yesterday_close-(Q*0.55);
	M0 = (S2+S3)/2;

if (Q > 5)
{
	nQ = Q;
}
else
{
	nQ = Q*10000;
}

if (D > 5)
{
	nD = D;
}
else
{
	nD = D*10000;
}


//Comment("Weekly High= ",weekly_high,"    Weekly Low= ",weekly_low,"\nHigh= ",yesterday_high,"    Previous Days Range= ",nQ,"\nLow= ",yesterday_low,"    Current Days Range= ",nD,"\nClose= ",yesterday_close);

//---- Set line labels on chart window

if (yesterdayHighLow==true)
   {
   // yesterdays highs and lows
   if(ObjectFind("YH label") != 0)
      {
      ObjectCreate("YH label", OBJ_TEXT, 0, Time[0], YH);
      ObjectSetText("YH label", "Yesterday\'s High  " +DoubleToStr(YH,4), 8, "Tahoma", Gray);
      }
      else
      {
      ObjectMove("YH label", 0, Time[0], YH);
      }

   if(ObjectFind("YL label") != 0)
      {
      ObjectCreate("YL label", OBJ_TEXT, 0, Time[0], YL);
      ObjectSetText("YL label", "Yesterday\'s Low  " +DoubleToStr(YL,4), 8, "Tahoma", Gray);
      }
      else
      {
      ObjectMove("YL label", 0, Time[0], YL);
      }

      if(ObjectFind("YH line") != 0)
      {
      ObjectCreate("YH line", OBJ_HLINE, 0, Time[40], YH);
      ObjectSet("YH line", OBJPROP_STYLE, STYLE_DASHDOT);
      ObjectSet("YH line", OBJPROP_COLOR, Green);
      ObjectSet("YH line", OBJPROP_WIDTH, 1);
      }
      else
      {
      ObjectMove("YH line", 0, Time[40], YH);
      }

   if(ObjectFind("YL line") != 0)
      {
      ObjectCreate("YL line", OBJ_HLINE, 0, Time[40], YL);
      ObjectSet("YL line", OBJPROP_STYLE, STYLE_DASHDOT);
      ObjectSet("YL line", OBJPROP_COLOR, Red);
      ObjectSet("YL line", OBJPROP_WIDTH, 1);
      }
      else
      {
      ObjectMove("YL line", 0, Time[40], YL);
      }
   }


//---- Pivot Lines
   if (pivots==true)
   {
      if(ObjectFind("R1 label") != 0)
      {
      ObjectCreate("R1 label", OBJ_TEXT, 0, Time[20], R1);
      ObjectSetText("R1 label", " R1", 8, "Arial", Gray);
      }
      else
      {
      ObjectMove("R1 label", 0, Time[20], R1);
      }

      if(ObjectFind("R2 label") != 0)
      {
      ObjectCreate("R2 label", OBJ_TEXT, 0, Time[20], R2);
      ObjectSetText("R2 label", " R2", 8, "Arial", Gray);
      }
      else
      {
      ObjectMove("R2 label", 0, Time[20], R2);
      }

      if(ObjectFind("R3 label") != 0)
      {
      ObjectCreate("R3 label", OBJ_TEXT, 0, Time[20], R3);
      ObjectSetText("R3 label", " R3", 8, "Arial", Gray);
      }
      else
      {
      ObjectMove("R3 label", 0, Time[20], R3);
      }

      if(ObjectFind("P label") != 0)
      {
      ObjectCreate("P label", OBJ_TEXT, 0, Time[20], P);
      ObjectSetText("P label", "Pivot", 8, "Arial", Gray);
      }
      else
      {
      ObjectMove("P label", 0, Time[20], P);
      }

      if(ObjectFind("S1 label") != 0)
      {
      ObjectCreate("S1 label", OBJ_TEXT, 0, Time[20], S1);
      ObjectSetText("S1 label", "S1", 8, "Arial", Gray);
      }
      else
      {
      ObjectMove("S1 label", 0, Time[20], S1);
      }

      if(ObjectFind("S2 label") != 0)
      {
      ObjectCreate("S2 label", OBJ_TEXT, 0, Time[20], S2);
      ObjectSetText("S2 label", "S2", 8, "Arial", Gray);
      }
      else
      {
      ObjectMove("S2 label", 0, Time[20], S2);
      }

      if(ObjectFind("S3 label") != 0)
      {
      ObjectCreate("S3 label", OBJ_TEXT, 0, Time[20], S3);
      ObjectSetText("S3 label", "S3", 8, "Arial", Gray);
      }
      else
      {
      ObjectMove("S3 label", 0, Time[20], S3);
      }

//---  Draw  Pivot lines on chart
      if(ObjectFind("S1 line") != 0)
      {
      ObjectCreate("S1 line", OBJ_HLINE, 0, Time[40], S1);
      ObjectSet("S1 line", OBJPROP_STYLE, STYLE_DASHDOTDOT);
      ObjectSet("S1 line", OBJPROP_COLOR, Pink);
      }
      else
      {
      ObjectMove("S1 line", 0, Time[40], S1);
      }

      if(ObjectFind("S2 line") != 0)
      {
      ObjectCreate("S2 line", OBJ_HLINE, 0, Time[40], S2);
      ObjectSet("S2 line", OBJPROP_STYLE, STYLE_DASHDOTDOT);
      ObjectSet("S2 line", OBJPROP_COLOR, Pink);
      }
      else
      {
      ObjectMove("S2 line", 0, Time[40], S2);
      }

      if(ObjectFind("S3 line") != 0)
      {
      ObjectCreate("S3 line", OBJ_HLINE, 0, Time[40], S3);
      ObjectSet("S3 line", OBJPROP_STYLE, STYLE_DASHDOTDOT);
      ObjectSet("S3 line", OBJPROP_COLOR, Pink);
      }
      else
      {
      ObjectMove("S3 line", 0, Time[40], S3);
      }

      if(ObjectFind("P line") != 0)
      {
      ObjectCreate("P line", OBJ_HLINE, 0, Time[40], P);
      ObjectSet("P line", OBJPROP_STYLE, STYLE_DOT);
      ObjectSet("P line", OBJPROP_COLOR, LightSkyBlue);
      }
      else
      {
      ObjectMove("P line", 0, Time[40], P);
      }

      if(ObjectFind("R1 line") != 0)
      {
      ObjectCreate("R1 line", OBJ_HLINE, 0, Time[40], R1);
      ObjectSet("R1 line", OBJPROP_STYLE, STYLE_DASHDOTDOT);
      ObjectSet("R1 line", OBJPROP_COLOR, LightGreen);
      }
      else
      {
      ObjectMove("R1 line", 0, Time[40], R1);
      }

      if(ObjectFind("R2 line") != 0)
      {
      ObjectCreate("R2 line", OBJ_HLINE, 0, Time[40], R2);
      ObjectSet("R2 line", OBJPROP_STYLE, STYLE_DASHDOTDOT);
      ObjectSet("R2 line", OBJPROP_COLOR, LightGreen);
      }
      else
      {
      ObjectMove("R2 line", 0, Time[40], R2);
      }

      if(ObjectFind("R3 line") != 0)
      {
      ObjectCreate("R3 line", OBJ_HLINE, 0, Time[40], R3);
      ObjectSet("R3 line", OBJPROP_STYLE, STYLE_DASHDOTDOT);
      ObjectSet("R3 line", OBJPROP_COLOR, LightGreen);
      }
      else
      {
      ObjectMove("R3 line", 0, Time[40], R3);
      }
   }
//---- End of Pivot Line Draw


//----- Camarilla Lines

   if (camarilla==true)
   {
      if(ObjectFind("H4 label") != 0)
      {
      ObjectCreate("H4 label", OBJ_TEXT, 0, Time[20], H4);
      ObjectSetText("H4 label", " H4", 8, "Arial", Gray);
      }
      else
      {
      ObjectMove("H4 label", 0, Time[20], H4);
      }

      if(ObjectFind("H3 label") != 0)
      {
      ObjectCreate("H3 label", OBJ_TEXT, 0, Time[20], H3);
      ObjectSetText("H3 label", " H3", 8, "Arial", Gray);
      }
      else
      {
      ObjectMove("H3 label", 0, Time[20], H3);
      }

      if(ObjectFind("L3 label") != 0)
      {
      ObjectCreate("L3 label", OBJ_TEXT, 0, Time[20], L3);
      ObjectSetText("L3 label", " L3", 8, "Arial", Gray);
      }
      else
      {
      ObjectMove("L3 label", 0, Time[20], L3);
      }

      if(ObjectFind("L4 label") != 0)
      {
      ObjectCreate("L4 label", OBJ_TEXT, 0, Time[20], L4);
      ObjectSetText("L4 label", " L4", 8, "Arial", Gray);
      }
      else
      {
      ObjectMove("L4 label", 0, Time[20], L4);
      }

//---- Draw Camarilla lines on Chart
      if(ObjectFind("H4 line") != 0)
      {
      ObjectCreate("H4 line", OBJ_HLINE, 0, Time[40], H4);
      ObjectSet("H4 line", OBJPROP_STYLE, STYLE_DASHDOTDOT);
      ObjectSet("H4 line", OBJPROP_COLOR, Orange);
      }
      else
      {
      ObjectMove("H4 line", 0, Time[40], H4);
      }

      if(ObjectFind("H3 line") != 0)
      {
      ObjectCreate("H3 line", OBJ_HLINE, 0, Time[40], H3);
      ObjectSet("H3 line", OBJPROP_STYLE, STYLE_DASHDOTDOT);
      ObjectSet("H3 line", OBJPROP_COLOR, Orange);
      }
      else
      {
      ObjectMove("H3 line", 0, Time[40], H3);
      }

      if(ObjectFind("L3 line") != 0)
      {
      ObjectCreate("L3 line", OBJ_HLINE, 0, Time[40], L3);
      ObjectSet("L3 line", OBJPROP_STYLE, STYLE_DASHDOTDOT);
      ObjectSet("L3 line", OBJPROP_COLOR, Orange);
      }
      else
      {
      ObjectMove("L3 line", 0, Time[40], L3);
      }

      if(ObjectFind("L4 line") != 0)
      {
      ObjectCreate("L4 line", OBJ_HLINE, 0, Time[40], L4);
      ObjectSet("L4 line", OBJPROP_STYLE, STYLE_DASHDOTDOT);
      ObjectSet("L4 line", OBJPROP_COLOR, Orange);
      }
      else
      {
      ObjectMove("L4 line", 0, Time[40], L4);
      }
   }
//-------End of Draw Camarilla Lines

//------ Midpoints Pivots

   if (midpivots==true)
   {

      if(ObjectFind("M5 label") != 0)
      {
      ObjectCreate("M5 label", OBJ_TEXT, 0, Time[20], M5);
      ObjectSetText("M5 label", " M5", 8, "Arial", Gray);
      }
      else
      {
      ObjectMove("M5 label", 0, Time[20], M5);
      }

      if(ObjectFind("M4 label") != 0)
      {
      ObjectCreate("M4 label", OBJ_TEXT, 0, Time[20], M4);
      ObjectSetText("M4 label", " M4", 8, "Arial", Gray);
      }
      else
      {
      ObjectMove("M4 label", 0, Time[20], M4);
      }

      if(ObjectFind("M3 label") != 0)
      {
      ObjectCreate("M3 label", OBJ_TEXT, 0, Time[20], M3);
      ObjectSetText("M3 label", " M3", 8, "Arial", Gray);
      }
      else
      {
      ObjectMove("M3 label", 0, Time[20], M3);
      }

      if(ObjectFind("M2 label") != 0)
      {
      ObjectCreate("M2 label", OBJ_TEXT, 0, Time[20], M2);
      ObjectSetText("M2 label", " M2", 8, "Arial", Gray);
      }
      else
      {
      ObjectMove("M2 label", 0, Time[20], M2);
      }

      if(ObjectFind("M1 label") != 0)
      {
      ObjectCreate("M1 label", OBJ_TEXT, 0, Time[20], M1);
      ObjectSetText("M1 label", " M1", 8, "Arial", Gray);
      }
      else
      {
      ObjectMove("M1 label", 0, Time[20], M1);
      }

      if(ObjectFind("M0 label") != 0)
      {
      ObjectCreate("M0 label", OBJ_TEXT, 0, Time[20], M0);
      ObjectSetText("M0 label", " M0", 8, "Arial", Gray);
      }
      else
      {
      ObjectMove("M0 label", 0, Time[20], M0);
      }

//---- Draw Midpoint Pivots on Chart
      if(ObjectFind("M5 line") != 0)
      {
      ObjectCreate("M5 line", OBJ_HLINE, 0, Time[40], M5);
      ObjectSet("M5 line", OBJPROP_STYLE, STYLE_DASHDOTDOT);
      ObjectSet("M5 line", OBJPROP_COLOR, Blue);
      }
      else
      {
      ObjectMove("M5 line", 0, Time[40], M5);
      }

      if(ObjectFind("M4 line") != 0)
      {
      ObjectCreate("M4 line", OBJ_HLINE, 0, Time[40], M4);
      ObjectSet("M4 line", OBJPROP_STYLE, STYLE_DASHDOTDOT);
      ObjectSet("M4 line", OBJPROP_COLOR, Blue);
      }
      else
      {
      ObjectMove("M4 line", 0, Time[40], M4);
      }

      if(ObjectFind("M3 line") != 0)
      {
      ObjectCreate("M3 line", OBJ_HLINE, 0, Time[40], M3);
      ObjectSet("M3 line", OBJPROP_STYLE, STYLE_DASHDOTDOT);
      ObjectSet("M3 line", OBJPROP_COLOR, Blue);
      }
      else
      {
      ObjectMove("M3 line", 0, Time[40], M3);
      }

      if(ObjectFind("M2 line") != 0)
      {
      ObjectCreate("M2 line", OBJ_HLINE, 0, Time[40], M2);
      ObjectSet("M2 line", OBJPROP_STYLE, STYLE_DASHDOTDOT);
      ObjectSet("M2 line", OBJPROP_COLOR, Blue);
      }
      else
      {
      ObjectMove("M2 line", 0, Time[40], M2);
      }

      if(ObjectFind("M1 line") != 0)
      {
      ObjectCreate("M1 line", OBJ_HLINE, 0, Time[40], M1);
      ObjectSet("M1 line", OBJPROP_STYLE, STYLE_DASHDOTDOT);
      ObjectSet("M1 line", OBJPROP_COLOR, Blue);
      }
      else
      {
      ObjectMove("M1 line", 0, Time[40], M1);
      }

      if(ObjectFind("M0 line") != 0)
      {
      ObjectCreate("M0 line", OBJ_HLINE, 0, Time[40], M0);
      ObjectSet("M0 line", OBJPROP_STYLE, STYLE_DASHDOTDOT);
      ObjectSet("M0 line", OBJPROP_COLOR, Blue);
      }
      else
      {
      ObjectMove("M0 line", 0, Time[40], M0);
      }

   }
//----End of Midpoint Pivots Draw

//---- End Of Program
   return(0);
  }
//+------------------------------------------------------------------+
Comments