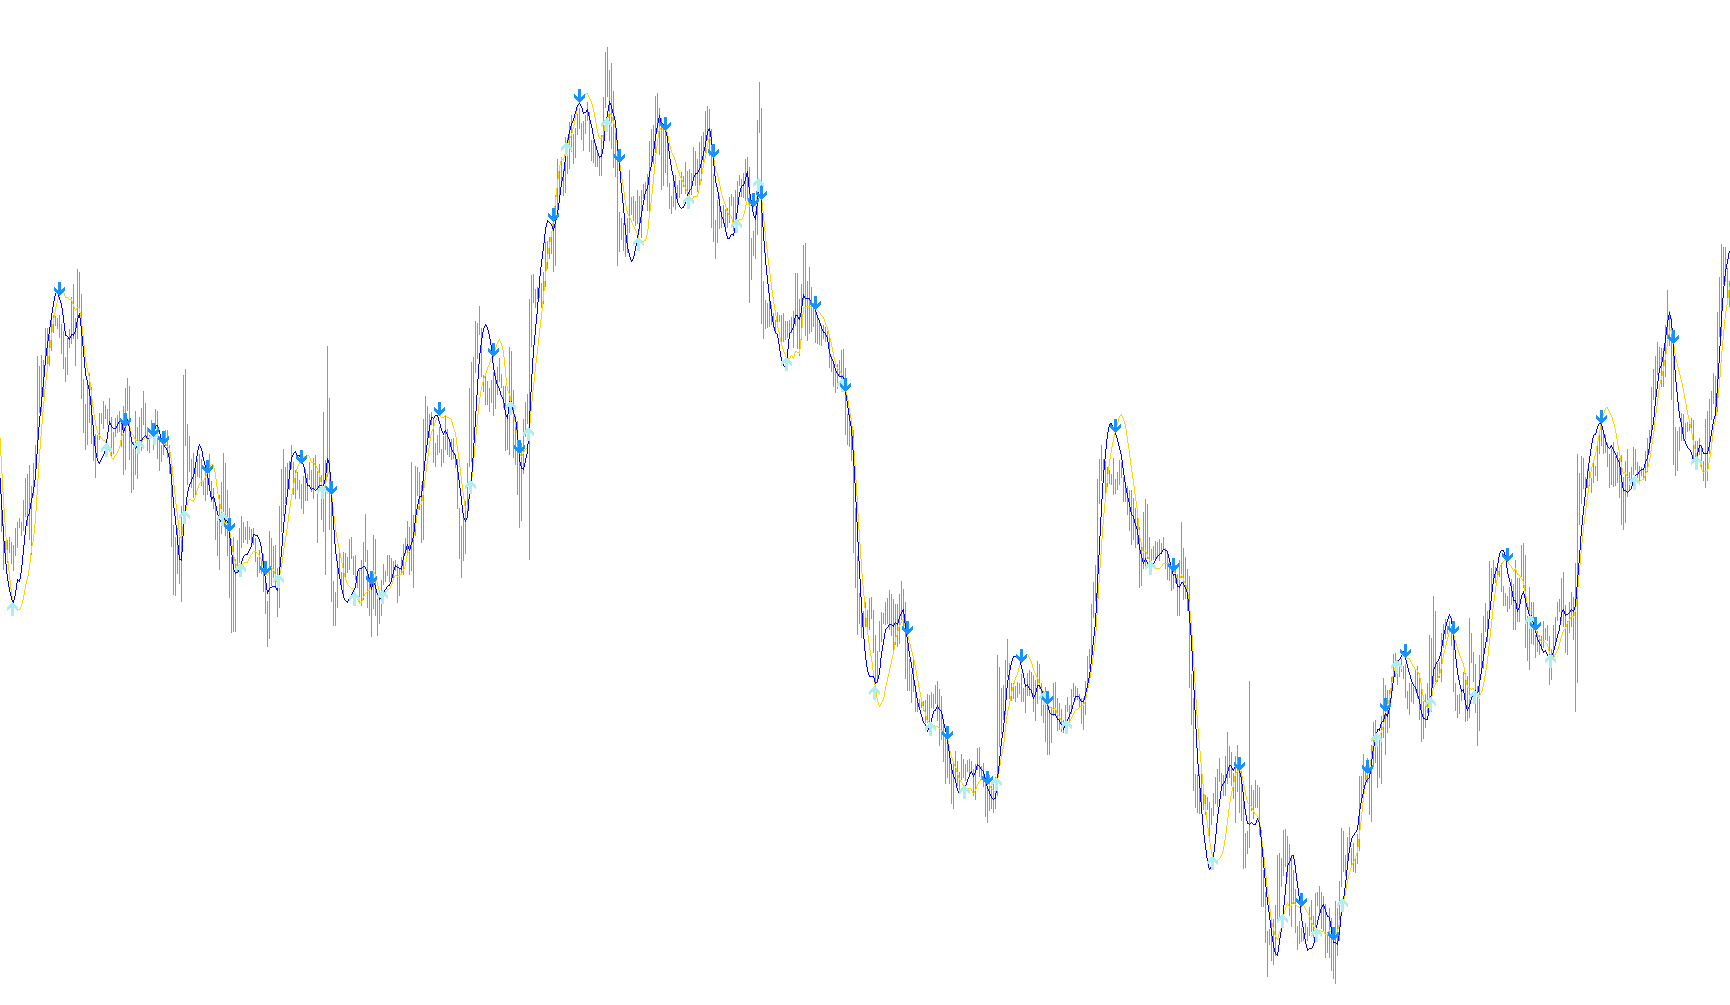
This tool is designed for traders who want to identify potential momentum shifts in the market by observing the relationship between two distinct moving averages. Unlike standard moving averages that treat all past data with equal importance, this script utilizes a "Linearly Weighted" approach, which gives more significance to recent price action while still accounting for historical trends.
Core Functionality
The script calculates and displays two specific visual lines on your trading chart:
- The Slow Line (Blue): This represents a longer-term trend based on a wider window of data (defaulting to 22 periods). It acts as the "baseline" for the broader market movement.
- The Fast Line (Red): This represents a shorter-term trend based on a smaller, more reactive window of data (defaulting to 15 periods). Because it reacts more quickly to new price changes, it is used to detect immediate shifts in sentiment.
How the Logic Works
The primary goal of this script is to identify "Crosses"—moments where the short-term momentum breaks away from or merges back into the long-term trend. The logic operates as follows:
- Trend Identification: The script constantly compares the current values of the Fast (Red) and Slow (Blue) lines.
- Buy Signals (Bullish Momentum): When the Fast line moves above the Slow line, it suggests that recent price strength is accelerating upward relative to the broader trend. The script marks these points on your chart with an upward-pointing arrow.
- Sell Signals (Bearish Momentum): Conversely, when the Fast line drops below the Slow line, it indicates that recent downward pressure is becoming dominant. The script marks these locations with a downward-pointing arrow.
- Real-Time Alerts: The tool can be configured to provide instant notifications. If a crossover occurs on the most recent live candle, the system can trigger an alert to notify you immediately of a "BUY" or "SELL" opportunity.
Key User Features
- Visual Clarity: The indicator uses different colors and line thicknesses to help distinguish between long-term stability and short-term volatility at a glance.
- Dynamic Weighting: By using a linear weighting system, the script ensures that the most recent price ticks have a greater impact on the current line position than older data points, making it more responsive to sudden market news or breakouts.
- Automation Ready: The inclusion of alert logic allows for a transition from manual chart watching to a more proactive trading style where you can receive notifications directly.
Miscellaneous
11
Views
0
Downloads
0
Favorites
LSMA-V1.2
//+------------------------------------------------------------------+
//|                                                        |
//|                      Copyright © 2006, MetaQuotes Software Corp. |
//|                                       http://www.metaquotes.net/ |
//+------------------------------------------------------------------+
#property  copyright                              "Copyright © 2006"
#property  link                         "http://www.metaquotes.net/"

//---- indicator settings
#property  indicator_chart_window
#property  indicator_buffers 4
#property indicator_color1 Blue
#property indicator_color2 Red
#property indicator_color3 SpringGreen
#property indicator_color4 Salmon

#property indicator_width1 3
#property indicator_width2 3
#property indicator_width3 2
#property indicator_width4 2

//---- buffers
double ExtMapBuffer1[];
double ExtMapBuffer2[];
double CrossUp[];
double CrossDown[];

extern int Flsma = 15;
extern int Slsma = 22;
extern bool CrossBarInProgress = false;
extern bool AlertCross= false;

double dFlsma,dSlsma;
double Fsum,Ssum;
double Fwt,Swt;
int BarInProgress;

//+------------------------------------------------------------------+
//| Custom indicator initialization function                         |
//+------------------------------------------------------------------+
int init()
  {
   dFlsma=Flsma;
   dSlsma=Slsma;
   BarInProgress=0;
//---- drawing settings
   SetIndexStyle(0,DRAW_LINE);
   SetIndexStyle(1,DRAW_LINE);
   SetIndexBuffer(0,ExtMapBuffer1);
   SetIndexBuffer(1,ExtMapBuffer2);

   SetIndexStyle(2, DRAW_ARROW, EMPTY);
   SetIndexArrow(2, 233);
   SetIndexBuffer(2, CrossUp);
   SetIndexStyle(3, DRAW_ARROW, EMPTY);
   SetIndexArrow(3, 234);
   SetIndexBuffer(3, CrossDown);
//---- initialization done
   return(0);
  }

int start()
  {
      if (Volume[0]>1 && !CrossBarInProgress)  BarInProgress=1; else BarInProgress=0;

      for(int shift = Bars-Slsma-1; shift >= BarInProgress; shift--)
      {
         Ssum = 0;
         Fsum = 0;
         for(int i = Slsma; i >= 1  ; i--)
         {
            Ssum=Ssum+( i - ((dSlsma + 1)/3) )*Close[Slsma-i+shift];
            if (i<=Flsma) Fsum = Fsum+( i - ((dFlsma + 1)/3) )*Close[Flsma-i+shift];
         }

         Swt = Ssum*6/(Slsma*(Slsma+1));
         Fwt = Fsum*6/(Flsma*(Flsma+1));

         ExtMapBuffer1[shift] = Swt; //Blue
         ExtMapBuffer2[shift] = Fwt; //Red

         CrossUp[shift]=0;
         CrossDown[shift]=0;
         if (Fwt>Swt && ExtMapBuffer2[shift+1]<ExtMapBuffer1[shift+1])
               {
                  CrossUp[shift] = Swt-10*Point;
                  if (AlertCross && shift==0) Alert("LSMA crossed, BUY ",Symbol()," at ",Close[0]);
               }
         else if (Fwt<Swt && ExtMapBuffer2[shift+1]>ExtMapBuffer1[shift+1])
               {
                  CrossDown[shift] = Swt+10*Point;
                  if (AlertCross && shift==0) Alert("LSMA crossed, SELL ",Symbol()," at ",Close[0]);
               }
      }

      return(0);
  }
//+------------------------------------------------------------------+
Comments