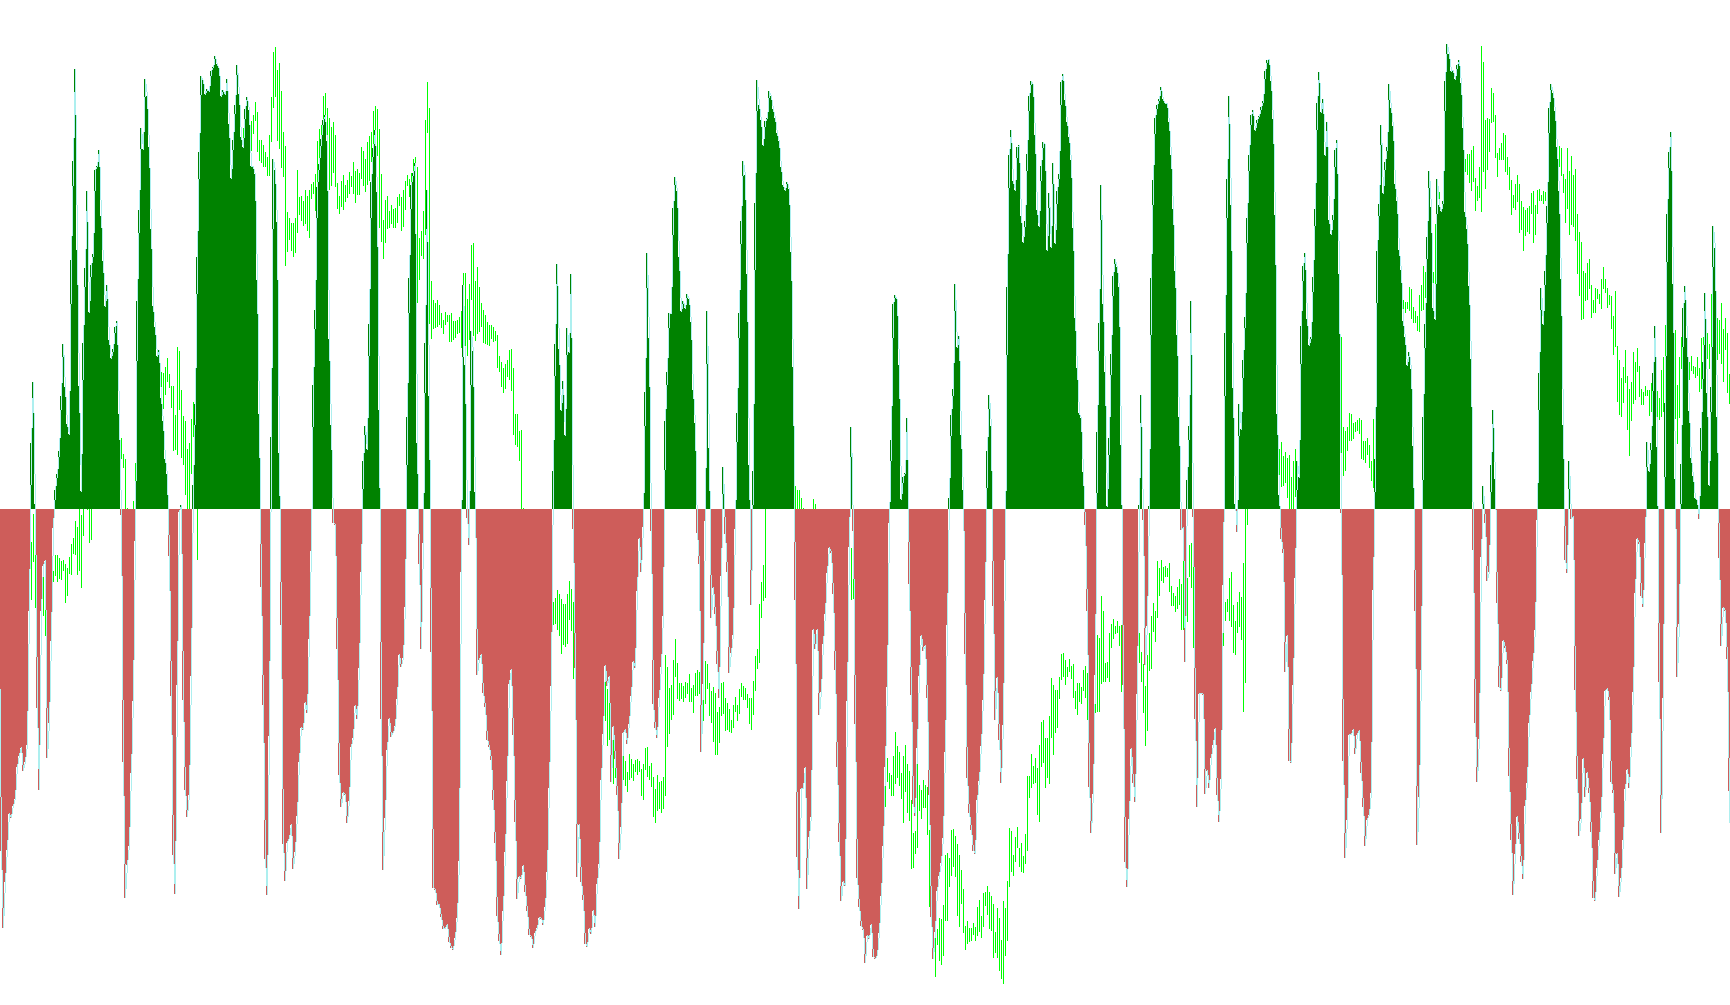
The Bollinger Squeeze v8 (StochHistogram_with_Alert) is a technical analysis tool designed to provide traders with a clear, visual representation of market momentum and direction. By combining elements of a Stochastic Oscillator with a specialized histogram display, the script aims to simplify how you identify trend shifts in real-time.
Core Logic and Functionality
The primary logic of this indicator revolves around measuring price momentum and filtering it into two distinct categories: upward strength and downward pressure. Here is how the system processes information:
1. Momentum Calculation The tool starts by calculating a "Stochastic" value based on your preferred settings (Period, Damping, and Slowing). This calculation identifies where the current price sits relative to its recent price range. To make this data more actionable for this specific indicator, the script centers the data around a zero-line.
2. The Histogram System (Visual Cues) Instead of showing a standard fluctuating line, the indicator uses a dual-histogram system to highlight the "sentiment" of the market:
- Uptrend Recognition: When the momentum value rises above the zero-line, the script generates a Green histogram. This indicates that the prevailing force in the market is currently positive.
- Downtrend Recognition: When the momentum value falls below the zero-line, the script generates an Indian Red histogram. This signals that the prevailing force in the market is currently negative.
3. Dynamic Alert System One of the most practical features of this script is its automated notification system. The tool monitors the "crossover" points—the exact moments when momentum switches from positive to negative or vice versa.
- If the momentum crosses above zero, the script triggers an alert indicating a potential move into a positive trend.
- If the momentum crosses below zero, it triggers an alert indicating a potential move into a negative trend.
How to Use This Information
By observing this indicator, you can quickly distinguish between "bullish" and "bearish" zones without getting lost in complex price fluctuations. The visual change from red to green (or vice versa) serves as a high-level summary of market activity, while the alerts ensure that you are notified immediately when the trend direction potentially flips, allowing for more timely decision-making.
/*
*********************************************************************

                      Bollinger Squeeze v8
                  (StochHistogram_with_Alert)
                 Original code by Nick Bilak
               Modifications by Akuma99 and Sadly
                   Copyright © 2006-07  Akuma99
                  http://www.beginnertrader.com

       For help on this indicator, tutorials and information
               visit http://www.beginnertrader.com

*********************************************************************
*/

#property copyright "Copyright © 2006-07, Akuma99"
#property copyright "Alert function added by Sadly"
#property link      "http://www.beginnertrader.com "


#property indicator_separate_window
#property indicator_buffers 3
#property indicator_color1 Green //uptrend
#property indicator_width1 2
#property indicator_color2 IndianRed  //downtrend
#property indicator_width2 2
#property indicator_color3 DarkGreen // First Stochastic line
#property indicator_width3 2


extern string note1 = "First Stochastic";
extern int    StochPeriod1=14;
extern int    DPeriod1=3;
extern int    SlowingPeriod1=3;
extern bool   Alert_On = 1;

double upB[];
double loB[];
double Stoch1[];

int Alerted = 1;

//+------------------------------------------------------------------+
int init() {

   IndicatorBuffers(3);

   SetIndexStyle(0,DRAW_HISTOGRAM,STYLE_SOLID,indicator_width1,indicator_color1);
   SetIndexBuffer(0,upB);
   SetIndexEmptyValue(0,EMPTY_VALUE);

   SetIndexStyle(1,DRAW_HISTOGRAM,STYLE_SOLID,indicator_width2,indicator_color2); //downtrend
   SetIndexBuffer(1,loB);
   SetIndexEmptyValue(1,EMPTY_VALUE);

   SetIndexStyle(2,DRAW_LINE);
   SetIndexBuffer(2,Stoch1);
   return(0);
}
//+------------------------------------------------------------------+
int deinit() {


}
//+------------------------------------------------------------------+
int start() {

   int counted_bars=IndicatorCounted();
   int shift,limit;

   IndicatorShortName("Stoch Histogram ("+StochPeriod1+","+DPeriod1+","+SlowingPeriod1+")");
   if (counted_bars<0) return(-1);
   if (counted_bars>0) counted_bars--;

   limit=Bars-31;
   if(counted_bars>=31) limit=Bars-counted_bars-1;

   for (shift=limit;shift>=0;shift--)   {

      Stoch1[shift]=iStochastic(NULL,0,StochPeriod1,DPeriod1,SlowingPeriod1,MODE_SMA,0,MODE_MAIN,shift)-50;

      if(Stoch1[shift]>0) {

         upB[shift]=Stoch1[shift];
         if(Alert_On && Alerted == -1){
         Alert("StochHist crossed above zero at ", Close[shift]);
         Alerted = 1;
         }

      } else if (Stoch1[shift]<0){

         loB[shift]=Stoch1[shift];
         if(Alert_On && Alerted == 1){
         Alert("StochHist crossed below zero at ", Close[shift]);
         Alerted = -1;
         }

      }
   }

   return(0);

}
//+------------------------------------------------------------------+
Comments