LSMA1
Download script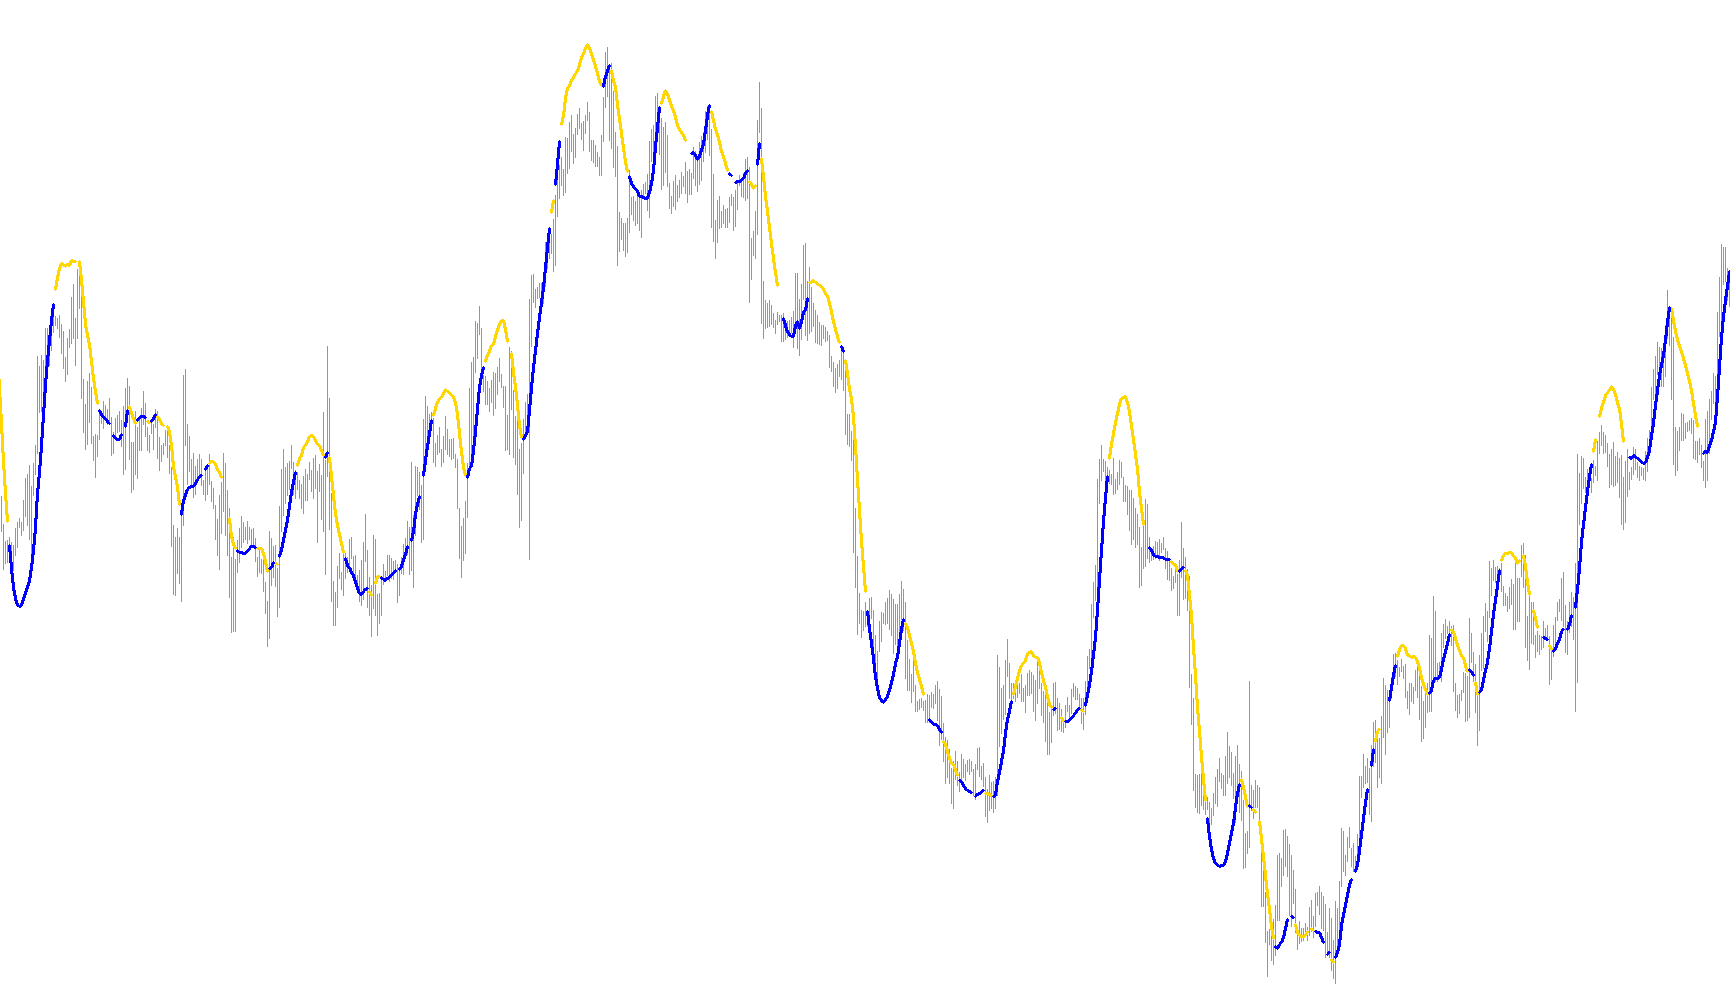
Overview
This script functions as a visual momentum and trend tracking tool designed for the MetaTrader platform. Rather than providing a standard moving average, it creates a dynamic "weighted" indicator that attempts to highlight the relationship between current price action and historical price trends. It operates in a separate window below your main chart, providing a clear visual cue of market direction.
How the Logic Works
The core functionality of this script can be broken down into three main stages:
1. Data Collection and Weighting The tool looks back at a specific number of past candles (defined by the user as the "Period"). Instead of treating every candle in that period equally, the script applies a mathematical weight to them. It calculates a weighted sum where prices are prioritized based on their position in time. This means that more recent price action has a different impact on the final calculation than older data, allowing the indicator to react more fluidly to current market shifts.
2. The Calculation Process The script performs a repetitive loop across your chart's history. For every point on the graph, it:
- Identifies the price range of the set period.
- Calculates a weighted average based on the mathematical formula provided in the logic.
- Produces a single "Weight Value" for that specific moment in time.
3. Visual Signaling (Color Coding) This is the most user-facing part of the script. The indicator creates two distinct visual lines—one in red and one in green. Its primary job is to compare the calculated "Weight Value" against the actual closing price of the candle:
- Green Signals: If the calculated weight value is higher than the current market price, the script highlights this relationship with a green line.
- Red Signals: If the calculated weight value is lower than the current market price, the script highlights this relationship with a red line.
- Filtering: To keep the chart clean, the script automatically hides (makes invisible) the line that does not meet the specific criteria for that moment. This ensures you only see the "active" signal—the color that represents the current dominant trend relative to the weighted average.
Summary for the User
Essentially, this tool acts as a visual filter. It processes historical data to create a weighted baseline and then "paints" the chart based on whether the price is currently trading above or below that baseline. By looking at the colors in the separate window, you can quickly identify whether the current market momentum is leaning toward one side of your weighted trend.
//+------------------------------------------------------------------+
//|                                                        |
//|                      Copyright © 2004, MetaQuotes Software Corp. |
//|                                       http://www.metaquotes.net/ |
//+------------------------------------------------------------------+
#property  copyright "Copyright © 2005, FX Sniper "
#property  link      "http://www.metaquotes.net/"

//---- indicator settings
#property  indicator_separate_window
#property  indicator_buffers 2
#property indicator_color1 Red
#property indicator_color2 Green


//---- buffers
double ExtMapBuffer1[];
double ExtMapBuffer2[];

extern int Rperiod = 25;
extern int Draw4HowLongg = 300;
int Draw4HowLong;
int shift;
int i;
int loopbegin;
double sum[];
int length;
double lengthvar;
double tmp ;
double wt[];

//+------------------------------------------------------------------+
//| Custom indicator initialization function                         |
//+------------------------------------------------------------------+
int init()
  {
//---- 2 additional buffers are used for counting.
   IndicatorBuffers(4);

//---- drawing settings
   SetIndexBuffer(0,ExtMapBuffer1);
   SetIndexBuffer(1,ExtMapBuffer2);
   SetIndexBuffer(2,sum);
   SetIndexBuffer(3,wt);
   SetIndexStyle(0,DRAW_LINE,1,3);
   SetIndexStyle(1,DRAW_LINE,1,3);

//---- initialization done
   return(0);
  }

int start()

  {   Draw4HowLong = Bars-Rperiod - 5;
      length = Rperiod;
      loopbegin = Draw4HowLong - length - 1;

      for(shift = loopbegin; shift >= 0; shift--)
      {
         sum[1] = 0;
         for(i = length; i >= 1  ; i--)
         {
         lengthvar = length + 1;
         lengthvar /= 3;
         tmp = 0;
         tmp = ( i - lengthvar)*Close[length-i+shift];
         sum[1]+=tmp;
         }
         wt[shift] = sum[1]*6/(length*(length+1));

//========== COLOR CODING ===========================================

       ExtMapBuffer1[shift] = wt[shift]; //red
       ExtMapBuffer2[shift] = wt[shift]; //green

        if (wt[shift] > Close[shift])
            ExtMapBuffer2[shift] = EMPTY_VALUE;
        else
        if (wt[shift] < Close[shift])
            ExtMapBuffer1[shift] = EMPTY_VALUE;
         }
      return(0);
  }
//+------------------------------------------------------------------+
Comments