LWMA_ATR
Download script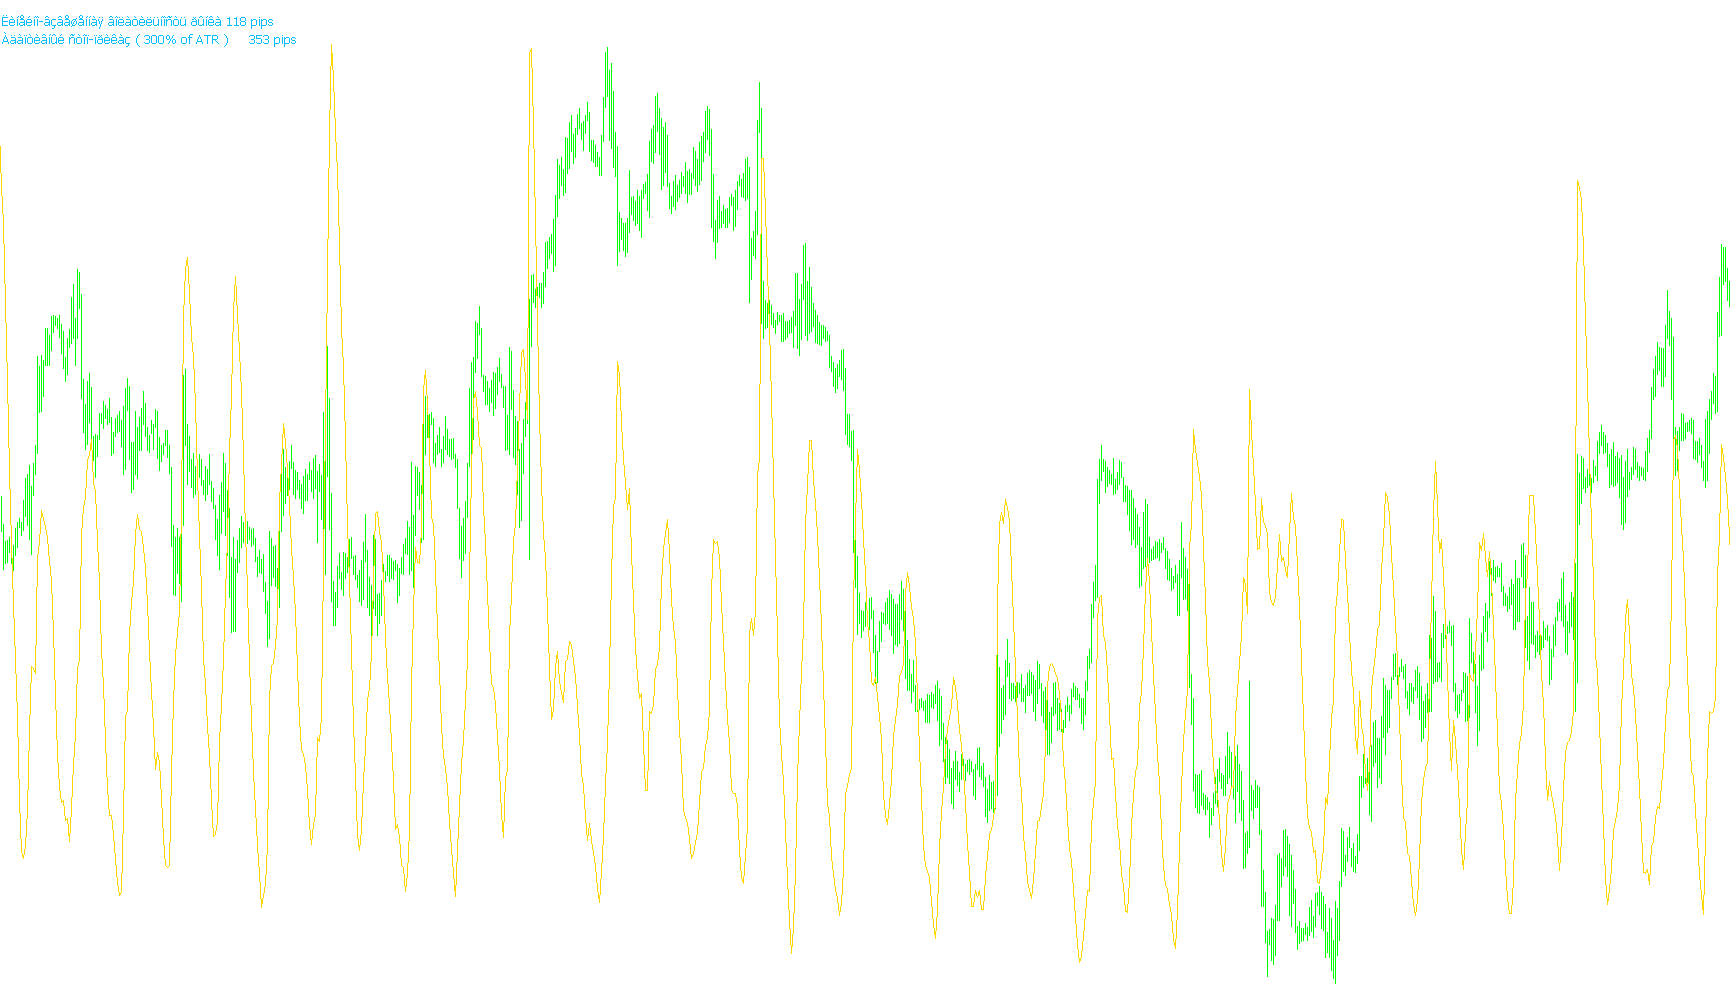
This script functions as a specialized market analysis tool designed to help traders understand and measure price volatility in real-time. Rather than looking at simple price movements, it focuses on the "range" of price action—specifically how much the market is swinging between its highs and lows over a specific period.
Core Logic and Mechanics
1. Volatility Measurement (ATR) The underlying logic is based on a concept similar to the Average True Range (ATR). The script calculates the distance covered by the market prices. For the most recent price candle, it looks at the direct difference between the high and low points. For older candles, it accounts for "gaps"—checking if the previous closing price was outside the current candle's range—to ensure the measurement captures all potential price movements, including overnight jumps.
2. Smoothing the Data To prevent the data from appearing erratic or "jittery," the script applies a Linear Weighted Moving Average (LWMA). This weighting system gives more importance to recent price action than older data. By smoothing the raw volatility numbers, the tool provides a much cleaner trend line that represents the current "heartbeat" of the market's movement.
3. Dynamic Target Calculation Beyond just showing a line on the chart, the script performs a secondary calculation based on a user-defined multiplier. It takes the smoothed volatility value and multiplies it to establish a "relative price range." This helps traders identify how much room the market typically has to move; for example, if the current volatility is 10 pips and the multiplier is set to 3, the script identifies a 30-pip range as a significant benchmark.
Visual Feedback
The tool provides immediate clarity by displaying two specific data points directly on your trading interface:
- Current Volatility: A live reading of how many pips the market is currently moving (the "strength" of the price swings).
- Relative Target Range: A calculated figure based on your chosen multiplier, helping you set visual expectations for potential profit targets or stop-loss zones based on current market conditions.
In essence, this script filters out the "noise" of individual price ticks to give you a clear, weighted picture of how much the market is moving, allowing for more disciplined entries and exits based on actual volatility.
//+------------------------------------------------------------------+
//|                                                     LWMA_ATR.mq4 |
//|                               Copyright © Sovpel Alexander, 2009 |
//+------------------------------------------------------------------+
#property copyright "Copyright © Sovpel Alexander, 2009"
#property link      "E-mail: Sovpel-Alexander@yandex.ru"

#property indicator_separate_window
#property indicator_buffers 1
#property indicator_color1 DodgerBlue
//---- input parameters
extern int AtrPeriod    =15;
extern int Multiplier   =3;
extern int Text_Corner  =0;
extern color Text_Color =DeepSkyBlue;
//---- buffers
double AtrBuffer[];
double TempBuffer[];
//+------------------------------------------------------------------+
//| Custom indicator initialization function                         |
//+------------------------------------------------------------------+
int init()
  {
   string short_name;
//---- 1 additional buffer used for counting.
   IndicatorBuffers(2);
//---- indicator line
   SetIndexStyle(0,DRAW_LINE);
   SetIndexBuffer(0,AtrBuffer);
   SetIndexBuffer(1,TempBuffer);
//---- name for DataWindow and indicator subwindow label
   short_name="LWMA_ATR("+AtrPeriod+")";
   IndicatorShortName(short_name);
   SetIndexLabel(0,short_name);
//----
   SetIndexDrawBegin(0,AtrPeriod);
//----
   ObjectCreate("ATR_0",OBJ_LABEL,0,TimeCurrent(),0,0);
   ObjectSet("ATR_0", OBJPROP_XDISTANCE, 5);
   ObjectSet("ATR_0", OBJPROP_YDISTANCE, 15);

   ObjectCreate("ATR_1",OBJ_LABEL,0,TimeCurrent(),0,0);
   ObjectSet("ATR_1", OBJPROP_XDISTANCE, 5);
   ObjectSet("ATR_1", OBJPROP_YDISTANCE, 33);

   return(0);
  }
//+------------------------------------------------------------------+
//| Average True Range                                               |
//+------------------------------------------------------------------+
int start()
  {
   int i,counted_bars=IndicatorCounted();
//----
   if(Bars<=AtrPeriod) return(0);
//---- initial zero
   if(counted_bars<1)
      for(i=1;i<=AtrPeriod;i++) AtrBuffer[Bars-i]=0.0;
//----
   i=Bars-counted_bars-1;
   while(i>=0)
     {
      double high=High[i];
      double low =Low[i];
      if(i==Bars-1) TempBuffer[i]=high-low;
      else
        {
         double prevclose=Close[i+1];
         TempBuffer[i]=(MathMax(high,prevclose)-MathMin(low,prevclose)) * 100000;
        }
      i--;
     }
//----
   if(counted_bars>0) counted_bars--;
   int limit=Bars-counted_bars;
   for(i=0; i<limit; i++)
      AtrBuffer[i]=iMAOnArray(TempBuffer,Bars,AtrPeriod,0,MODE_LWMA,i);
//----
   if(Multiplier != 1) int Percentage = Multiplier * 100;
//----
   ObjectSet("ATR_0", OBJPROP_CORNER, Text_Corner);
   ObjectSetText("ATR_0","Ëèíåéíî-âçâåøåííàÿ âîëàòèëüíîñòü ðûíêà "+DoubleToStr(AtrBuffer[0],0)+" pips", 10, "Tahoma", Text_Color);
//----
   ObjectSet("ATR_1", OBJPROP_CORNER, Text_Corner);
   ObjectSetText("ATR_1","Àäàïòèâíûé ñòîï-ïðèêàç ( "+Percentage+"% of ATR )     "+DoubleToStr(AtrBuffer[0] * Multiplier,0)+" pips", 10, "Tahoma", Text_Color);
//----
   return(0);
  }
//----
int deinit()
  {
   ObjectDelete("ATR_0");
   ObjectDelete("ATR_1");
   return;
  }
//+------------------------------------------------------------------+
Comments