sa#MTEI_Supertrend_v1
Download script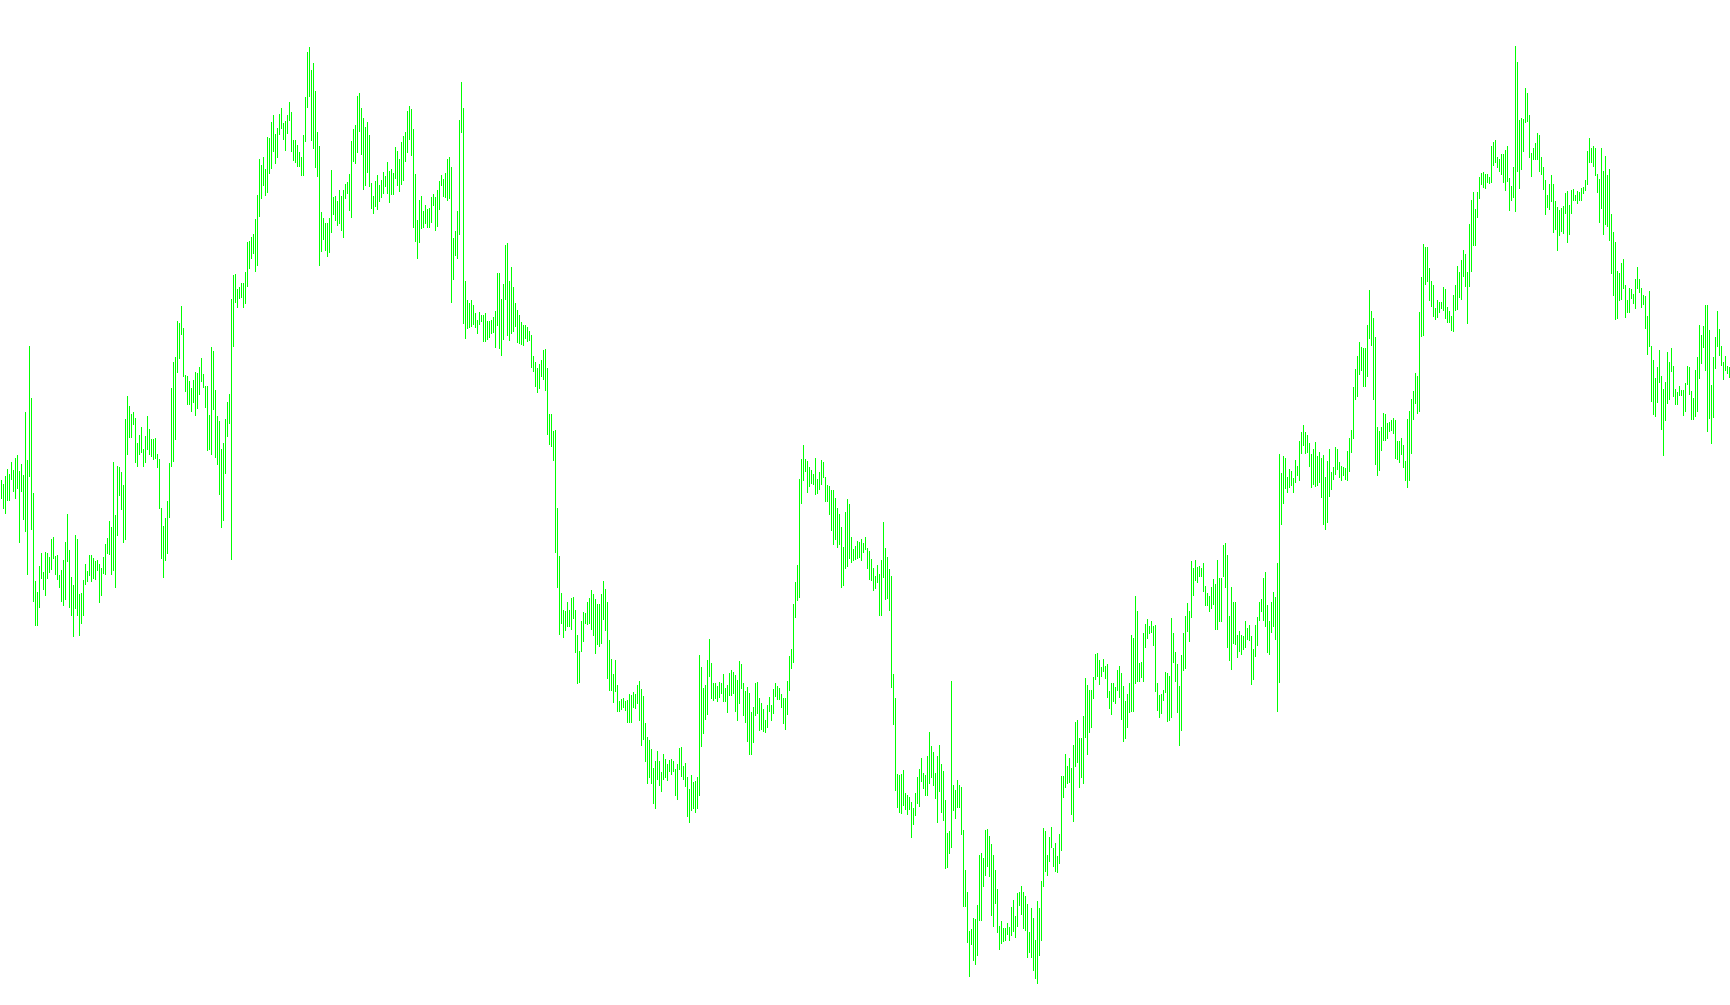
This indicator is designed to help traders visualize market trends by identifying whether the current price movement is leaning toward an "uptrend" or a "downtrend." It achieves this by combining three distinct types of market analysis: momentum, volatility, and historical price action.
Core Logic Breakdown
1. Momentum Tracking (CCI) The script uses a specific momentum oscillator (the Commodity Channel Index) to determine the overall "mood" of the market. By looking at the current value versus the previous value, the tool detects when momentum shifts significantly in one direction. It acts as a primary switch—when momentum crosses a certain threshold, it signals a potential change in trend.
2. Volatility Measurement (ATR) To ensure the trend lines aren't just reacting to tiny, insignificant price flickers, the script incorporates the Average True Range (ATR). This measures how much the market typically moves over a short period. By using this data, the indicator calculates "buffer zones" around the price. This helps the tool distinguish between normal market "noise" and meaningful price movements.
3. Dynamic Trend Lines Instead of drawing static lines, the script creates two dynamic boundaries:
- Upward Trend: When the momentum is positive, the script places a support line below the price. It constantly checks to make sure this line never moves downward, creating a steady floor that follows the price up.
- Downward Trend: When the momentum is negative, the script places a resistance line above the price. It ensures this line never moves upward, creating a ceiling that follows the price down as it falls.
How it appears on your chart
The indicator produces two visual lines (typically colored Lime and Red).
- When the market is in an uptrend, you will see a line trailing below the price candles, representing the "floor" of the move.
- When the market shifts to a downtrend, the logic flips, and the indicator displays a line above the candles, representing the "ceiling."
Summary for the Trader
In simple terms, this tool looks at how fast the price is moving (Momentum) and how much it usually swings (Volatility) to draw a "protective barrier" on your chart. If the price stays above the lower barrier, the trend is considered bullish; if it stays below the upper barrier, the trend is considered bearish. It effectively filters out minor fluctuations to show you the broader direction of the market.
//+------------------------------------------------------------------------+
//|                                                 sa#MTEI_Supertrend.mq4 |
//|http://finance.groups.yahoo.com/group/MetaTrader_Experts_and_Indicators/|
//+------------------------------------------------------------------------+
#property copyright ""
#property link      "http://finance.groups.yahoo.com/group/MetaTrader_Experts_and_Indicators/"

#property indicator_chart_window
#property indicator_buffers 4
#property indicator_color1 Lime
#property indicator_color2 Red


double TrendUp[];
double TrendDown[];
int st = 0;
//extern int SlowerEMA = 6;


//+------------------------------------------------------------------+
//| Custom indicator initialization function|
//+------------------------------------------------------------------+
int init()
 {
//---- indicators

  SetIndexStyle(0, DRAW_LINE, STYLE_SOLID, 2);
  SetIndexBuffer(0, TrendUp);
  SetIndexStyle(1, DRAW_LINE, STYLE_SOLID, 2);
  SetIndexBuffer(1, TrendDown);

  /*SetIndexStyle(0, DRAW_ARROW, EMPTY);
  SetIndexArrow(0, 159);
  SetIndexBuffer(0, TrendUp);
  SetIndexStyle(1, DRAW_ARROW, EMPTY);
  SetIndexArrow(1, 159);
  SetIndexBuffer(1, TrendDown);*/

  /*for(int i = 0; i < Bars; i++) {
     TrendUp[i] = NULL;
     TrendDown[i] = NULL;
  }*/
//----
  return(0);
 }
//+------------------------------------------------------------------+
//| Custor indicator deinitialization function|
//+------------------------------------------------------------------+
int deinit()
 {
//----
  /*for(int i = 0; i < Bars; i++) {
     TrendUp[i] = NULL;
     TrendDown[i] = NULL;
  }*/
//----
  return(0);
 }
//+------------------------------------------------------------------+
//| Custom indicator iteration function|
//+------------------------------------------------------------------+
int start()
 {

  int limit, i, counter;
  double Range, AvgRange, cciTrendNow, cciTrendPrevious, var;

  int counted_bars = IndicatorCounted();
//---- check for possible errors
  if(counted_bars < 0) return(-1);
//---- last counted bar will be recounted
  if(counted_bars > 0) counted_bars--;

  limit=Bars-counted_bars;

  for(i = limit; i >= 0; i--) {
     cciTrendNow = iCCI(NULL, 0, 50, PRICE_TYPICAL, i);
     cciTrendPrevious = iCCI(NULL, 0, 50, PRICE_TYPICAL, i+1);

     //st = st * 100;


     counter = i;
     Range = 0;
     AvgRange = 0;
     for (counter = i; counter >= i-9; counter--) {
        AvgRange = AvgRange + MathAbs(High[counter]-Low[counter]);
     }
     Range = AvgRange/10;
     if (cciTrendNow >= st && cciTrendPrevious < st) {
        TrendUp[i+1] = TrendDown[i+1];
     }

     if (cciTrendNow <= st && cciTrendPrevious > st) {
        TrendDown[i+1] = TrendUp[i+1];
     }

     if (cciTrendNow >= st) {
        TrendUp[i] = Low[i] - iATR(NULL, 0, 5, i);
        if (TrendUp[i] < TrendUp[i+1]) {
           TrendUp[i] = TrendUp[i+1];
        }
     }
     else if (cciTrendNow <= st) {
        TrendDown[i] = High[i] + iATR(NULL, 0, 5, i);
        if (TrendDown[i] > TrendDown[i+1]) {
           TrendDown[i] = TrendDown[i+1];
        }
     }
  }

//----

//----
  return(0);
 }

//+------------------------------------------------------------------+
Comments