MA_ribbon
Download script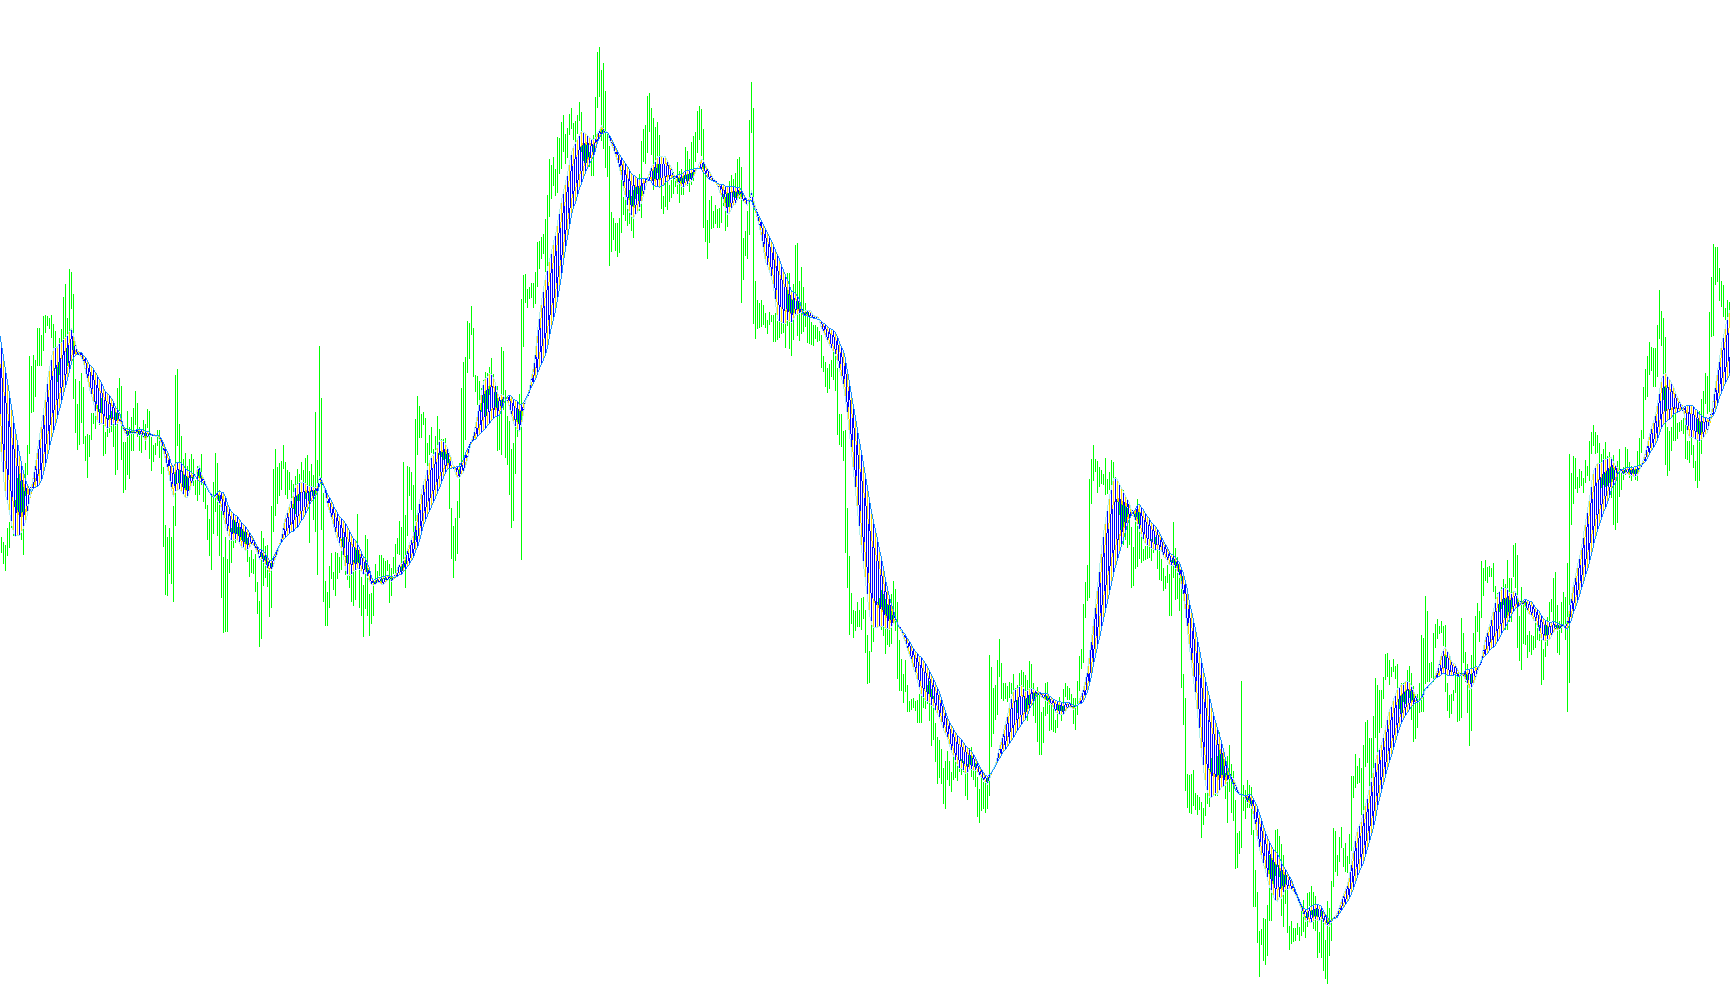
This script functions as a visual trend-tracking tool designed to help traders identify the direction and momentum of the market. It works by creating a "ribbon" or a dual-line system that tracks moving averages, which are essentially smoothed versions of price data to filter out minor market noise.
How the Logic Works
The core functionality relies on two distinct moving averages: a faster one (designed to react more quickly to recent price changes) and a slower one (designed to capture the broader trend).
Instead of simply plotting these two lines normally, the script uses a logic system to manage their visual appearance and "swapping" behavior. Here is the step-by-step breakdown:
- Trend Identification: The tool constantly calculates both the fast and slow moving averages based on your chosen timeframes and price types.
- The Swap Mechanism: The unique logic here lies in how the lines are displayed. The script compares the position of the two averages from one moment in time to the next. If it detects that the values have crossed or shifted in a specific way relative to the previous bar, the script "swaps" which line is represented by which color/buffer.
- Visual Flow: By switching the underlying data of the colors dynamically, the indicator creates a cohesive visual flow. This helps the user see shifts in momentum more clearly; when the lines interact, the visual transition helps highlight where a trend might be gaining strength or losing steam.
Purpose for the Trader
The goal of this logic is to provide a cleaner, more intuitive view of market trends. By using this "swapping" behavior, the indicator helps you visualize the relationship between short-term price action and long-term trends, making it easier to spot transitions in the market's direction without being distracted by erratic price spikes.
//+------------------------------------------------------------------+
//|                                                    MA ribbon.mq4 |
//|                                               mladenfx@gmail.com |
//|                                                                  |
//| original idea by Jose Silva                                      |
//+------------------------------------------------------------------+
#property copyright "mladen"
#property link      "mladenfx@gmail.com"

#property indicator_chart_window
#property indicator_buffers 4
#property indicator_color1 DarkSlateGray
#property indicator_color2 DarkSlateGray
#property indicator_color3 Red
#property indicator_color4 Green
#property indicator_width3 2
#property indicator_width4 2

//
//
//
//
//

extern int       MA1Period=13;
extern int       MA1Method=MODE_SMA;
extern int       MA1Price =PRICE_CLOSE;
extern int       MA2Period=26;
extern int       MA2Method=MODE_SMA;
extern int       MA2Price =PRICE_CLOSE;

//
//
//
//
//

double buffer1[];
double buffer2[];
double buffer3[];
double buffer4[];

//+------------------------------------------------------------------+
//|                                                                  |
//+------------------------------------------------------------------+
//
//
//
//
//

int init()
{
   SetIndexBuffer(0,buffer3);
   SetIndexBuffer(1,buffer4);
   SetIndexBuffer(2,buffer1);
   SetIndexBuffer(3,buffer2);
   return(0);
}
int deinit()
{
   return(0);
}

//+------------------------------------------------------------------+
//|                                                                  |
//+------------------------------------------------------------------+
//
//
//
//
//

int start()
{
   int counted_bars=IndicatorCounted();
   int limit,i;

   if(counted_bars<0) return(-1);
   if(counted_bars>0) counted_bars--;
           limit=Bars-counted_bars;

   //
   //
   //
   //
   //

   for(i=limit; i>=0; i--)
   {
      buffer1[i] = iMA(NULL,0,MA1Period,0,MA1Method,MA1Price,i);
      buffer2[i] = iMA(NULL,0,MA2Period,0,MA2Method,MA2Price,i);
      if (buffer3[i+1] == buffer1[i+1])
         {
            buffer3[i] = buffer2[i];
            buffer4[i] = buffer1[i];
         }
      else
         {
            buffer3[i] = buffer1[i];
            buffer4[i] = buffer2[i];
         }
   }
   return(0);
}
Comments