ma_bbands
Download script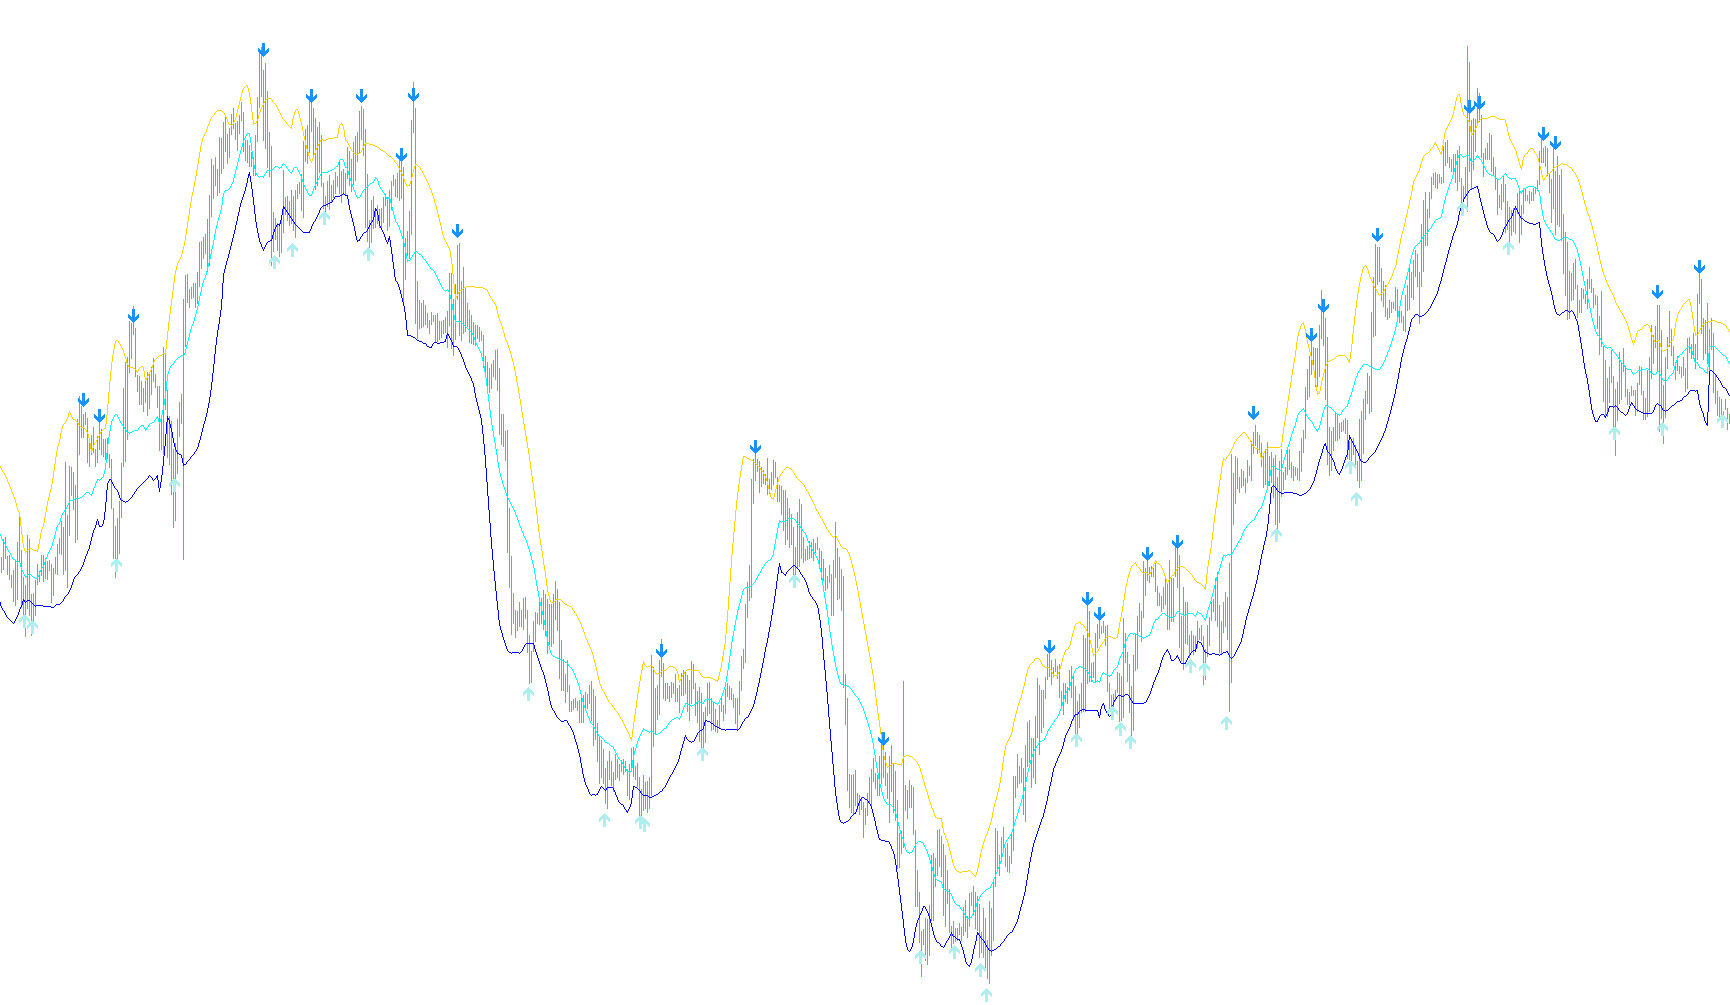
This script is designed as a technical analysis tool for MetaTrader platforms, specifically engineered to help traders identify potential price reversal zones by blending two distinct types of moving averages and volatility bands.
Core Logic Overview
The logic operates by calculating "upper" and "lower" boundaries of the market. Instead of simply using standard indicators in isolation, it compares different moving average types (Simple Moving Averages and Linear Weighted Moving Averages) against Bollinger Bands to create a dynamic "trading envelope."
Here is the step-by-step breakdown of how the script processes data:
1. Boundary Establishment
- Upper Boundaries: The script looks at high price points and calculates a specific moving average. It compares this against the upper Bollinger Band. Depending on which value is higher, it sets a "ceiling" for the market, applying a slight offset (distance) to ensure the line doesn't stick directly to the price action.
- Lower Boundaries: Similarly, it looks at low price points and calculates a moving average to compare against the lower Bollinger Band. It establishes a "floor" for the market using these results, again applying an offset to create a buffer zone.
2. The Equilibrium Line
- The script automatically generates a middle line (the fifth buffer). This is calculated by taking the mathematical average of the upper and lower boundaries established in the first step. This represents the "fair value" or center point of the current price volatility.
3. Signal Identification (Arrows) The most critical part of the logic is the generation of visual signals (arrows), which occur when specific three-part conditions are met simultaneously:
- Bullish Signal (Buy): An arrow is triggered if a specialized Oscillator (OsMA) crosses from negative to positive values, while the market price simultaneously drops below the calculated "floor" boundary. This suggests that the downward momentum has reached an extreme and may be ready to bounce back up.
- Bearish Signal (Sell): An arrow is triggered if the OsMA Oscillator crosses from positive to negative values, while the market price simultaneously breaks above the calculated "ceiling" boundary. This suggests that upward momentum has exhausted and a reversal downward may be imminent.
Summary for Traders
Essentially, this script filters out "noise" by creating a custom price corridor. It ignores standard movements and only alerts the user when the price interacts with these extreme boundaries in a way that is confirmed by an independent oscillator. It seeks to identify "overextended" market conditions where a price correction is statistically more likely to occur.
ÿþ//+------------------------------------------------------------------+
//|                                                    MA_BBands.mq4 |
//|                   Copyright 2005-2014, MetaQuotes Software Corp. |
//|                                              http://www.mql4.com |
//|                                        E-MAIL:40468962@qq.com    |
//+------------------------------------------------------------------+
#property copyright   "2005-2014, MetaQuotes Software Corp."
#property link        "http://www.mql4.com"

#property indicator_chart_window
#property indicator_buffers 5
#property indicator_color1 White
#property indicator_color2 White
#property indicator_color3 Blue
#property indicator_color4 Red
#property indicator_color5 Yellow

#property  indicator_width1  2
#property  indicator_width2  2
#property  indicator_width3  1
#property  indicator_width4  1
#property  indicator_width5  1


extern int MoveShift = 12;
extern int MAPeriod = 9 ;
extern int OsMA = 3 ;
extern int Dist2 = 20 ;
//-------------------------

extern double Std = 0.4 ; //0.5
extern int BPeriod = 20 ;


//-------------------------

double ExtMapBuffer1[];
double ExtMapBuffer2[];
double ExtMapBuffer3[];
double ExtMapBuffer4[];
double ExtMapBuffer5[];
//-------------------

int init()
  {

   IndicatorBuffers(5);

   SetIndexStyle(0,DRAW_LINE);
   SetIndexBuffer(0,ExtMapBuffer1);

   SetIndexStyle(1,DRAW_LINE);
   SetIndexBuffer(1,ExtMapBuffer2);

   SetIndexStyle(2,DRAW_ARROW);
   SetIndexArrow(2,233);
   SetIndexBuffer(2,ExtMapBuffer3);
   SetIndexEmptyValue(2,0.0);

   SetIndexStyle(3,DRAW_ARROW);
   SetIndexArrow(3,234);
   SetIndexBuffer(3,ExtMapBuffer4);
   SetIndexEmptyValue(3,0.0);

   SetIndexStyle(4,DRAW_LINE);
   SetIndexBuffer(4,ExtMapBuffer5);


   return(0);
  }
//----------------------------------------

int deinit()
  {return(0);}
//----------------------------------------
int start()
  {
  Comment( " MA_BBands_USDJPY_M5" );
    int counted_bars=IndicatorCounted();
    if(counted_bars<0) return(-1);
    if(counted_bars>0) counted_bars--;
    int limit=Bars-counted_bars;
    double OsMA_Now, OsMA_Pre;

    for(int i=limit-1; i>=0; i--)
     {
           double MAUP1 = iMA(NULL,0,MAPeriod,-MoveShift,MODE_SMA,PRICE_HIGH,i);
           double BB_UP = iBands(NULL,0,BPeriod,Std,0,PRICE_HIGH,MODE_UPPER,i);
           double MA_HIGH = iMA(NULL,0,4,0,MODE_LWMA,PRICE_HIGH,i);

           double MADN1 = iMA(NULL,0,MAPeriod,-MoveShift,MODE_SMA,PRICE_LOW,i);
           double BB_DN = iBands(NULL,0,BPeriod,Std,0,PRICE_LOW ,MODE_LOWER,i);
           double MA_LOW = iMA(NULL,0,4,0,MODE_LWMA,PRICE_LOW,i);


          if (MAUP1>BB_UP) {ExtMapBuffer1[i]=MAUP1+Dist2*Point; BB_UP=EMPTY_VALUE ;}
          else if (MAUP1<BB_UP) {ExtMapBuffer1[i]=BB_UP ; MAUP1=EMPTY_VALUE ;}
//--------------------------------------------------------------------


         if( MADN1 >0.0 )
         {
          if ( MADN1<BB_DN)  {ExtMapBuffer2[i]=MADN1-Dist2*Point; BB_DN=EMPTY_VALUE ;}
          else if (MADN1>BB_DN) { ExtMapBuffer2[i]=BB_DN ; MADN1=EMPTY_VALUE ; }
         }

         if (MADN1 ==0.0 ) { ExtMapBuffer2[i]=BB_DN; MADN1=EMPTY_VALUE ;}
//------------------------------------------------------------
       OsMA_Now = iOsMA(NULL,0,5,9,OsMA,PRICE_CLOSE,i) ;
       OsMA_Pre = iOsMA(NULL,0,5,9,OsMA,PRICE_CLOSE,i+1) ;

//-------------------
        if((OsMA_Now>0 && OsMA_Pre<0)&&(MA_LOW < ExtMapBuffer2[i]) && (Low[i] < ExtMapBuffer2[i]) )
       {
        ExtMapBuffer3[i+1] = Low[i]-30*Point;
       }

       if((OsMA_Now<0 && OsMA_Pre>0) && (MA_HIGH > ExtMapBuffer1[i]) && (High[i] > ExtMapBuffer1[i]) )
       {
        ExtMapBuffer4[i+1] = High[i]+30*Point;
       }


       ExtMapBuffer5[i] = (ExtMapBuffer1[i] +ExtMapBuffer2[i])/2.0 ;

     }

   return(0);
   RefreshRates();

  }
//--------------------------------
Comments