!!DailyPivot
Download script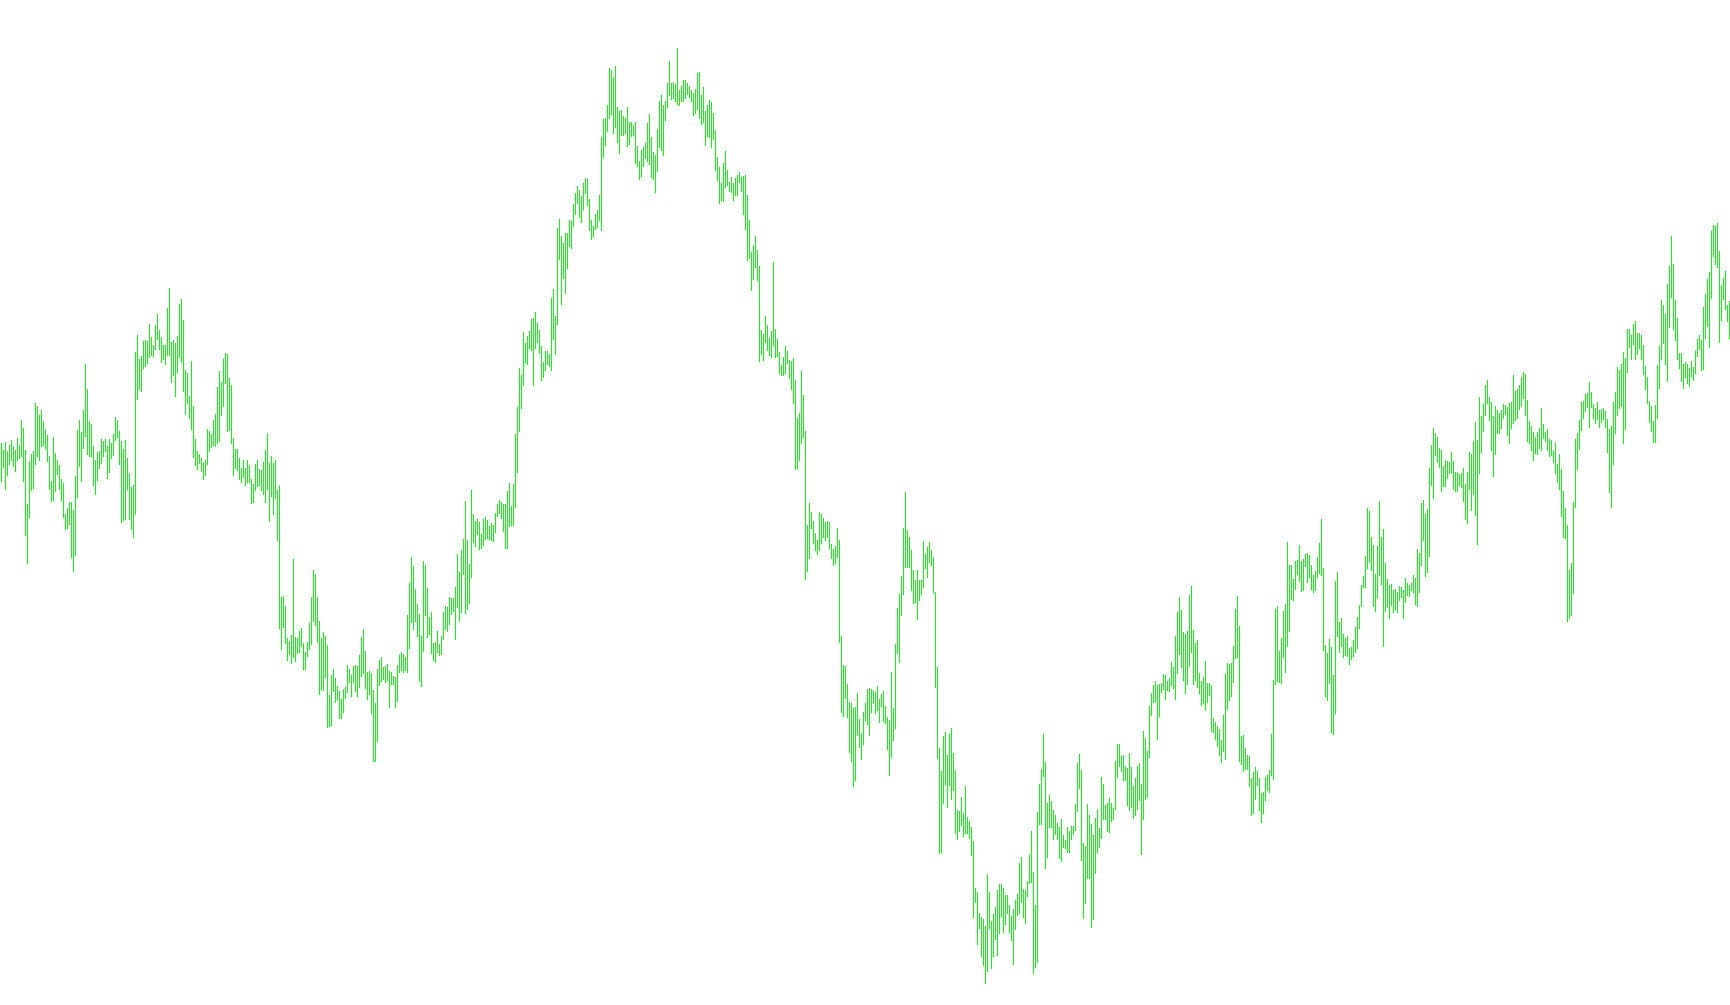
This script is a specialized technical analysis tool designed to identify key price levels and momentum shifts on a trading chart. Its primary purpose is to automatically calculate and display significant "Pivot" points based on daily price action, helping traders visualize whether the market is currently trending in an upward or downward direction relative to its median value.
Core Logic and Functionality
1. Dynamic Time Period Tracking The tool operates by analyzing a specific time window (the Gross Period). It intelligently adjusts to the chart's timeframe to ensure that the calculations remain relevant. It tracks the progression of days to distinguish between different trading sessions, ensuring that the data points are correctly aligned with daily cycles.
2. Median Price Calculation At the heart of the script is a specialized moving average calculation. Rather than using a standard average, it focuses on the "Median Price." By calculating this over the specified period, the tool identifies the "equilibrium" or "fair value" price for that specific time block.
3. Trend Identification (Up vs. Down) The script continuously compares the current market closing price against the calculated Median Price to determine the prevailing sentiment:
- Bullish Sentiment: If the current price is above the Median Price, the tool identifies an "Upline" trend. It captures the highs and lows of these specific candles to provide a visual representation of the price range during an upward move.
- Bearish Sentiment: If the current price falls below the Median Price, the tool identifies a "Downline" trend. Similarly, it marks the highs and lows for these periods to highlight the volatility of the downward move.
4. Visual Signaling To make this data easy for a human trader to read at a glance, the script translates these calculations into visual elements on the chart:
- Histograms/Markers: It places distinct markers (uplines and downlines) that appear only when the price meets specific conditions relative to the median.
- Dynamic Updates: The tool includes a refresh mechanism to ensure that as new prices are tick in, the visual indicators update instantly, providing real-time feedback on whether the market has crossed a critical threshold.
Summary for the Trader
Essentially, this script acts as a "filter" for market noise. Instead of showing every single price movement, it highlights only the significant price action that occurs above or below the daily median. It allows you to see clearly where the "strength" is coming from—whether the market is pushing higher against its average or retreating lower—providing a structured visual guide for potential entry and exit zones.
//+------------------------------------------------------------------+
//|                                                 !!DailyPivot.mq4 |
//|                      Copyright © 2011, MetaQuotes Software Corp. |
//|                                        http://www.metaquotes.net |
//+------------------------------------------------------------------+
#property copyright "Copyright @2011, Rockyhoangdn"
#property link      "rockyhoangdn@gmail.com"
#property indicator_chart_window
#property indicator_buffers 6
#property indicator_color1  Green
#property indicator_color2  Green
#property indicator_color3  Blue
#property indicator_color4  Yellow
#property indicator_color5  FireBrick
#property indicator_color6  FireBrick
#property indicator_color7  FireBrick
#property indicator_color8  FireBrick

#property indicator_width1 4
#property indicator_width2 4
#property indicator_width3 0
#property indicator_width4 0
#property indicator_width5 4
#property indicator_width6 4
#property indicator_width7 4
#property indicator_width8 4

//---- input parameters
extern int GrossPeriod=1440;
extern int Barss=0;
//---- buffers
double ExtMapBuffer1[];
double ExtMapBuffer2[];
double ExtMapBuffer3[];
double ExtMapBuffer4[];
double ExtMapBuffer5[];
double ExtMapBuffer6[];
double ExtMapBuffer7[];
double ExtMapBuffer8[];
datetime daytimes[];
//+------------------------------------------------------------------+
//| Custom indicator initialization function                         |
//+------------------------------------------------------------------+
int init()
  {
//---- indicators
   SetIndexStyle(0,DRAW_HISTOGRAM);
   SetIndexArrow(0,159);
   SetIndexBuffer(0,ExtMapBuffer1);
   SetIndexEmptyValue(0,0.0);
   SetIndexLabel(0,"upline");


   SetIndexStyle(1,DRAW_HISTOGRAM);
   SetIndexArrow(1,159);
   SetIndexBuffer(1,ExtMapBuffer2);
   SetIndexEmptyValue(1,0.0);
   SetIndexLabel(1,"upline");


   SetIndexStyle(2,DRAW_ARROW);
   SetIndexArrow(2,159);
   SetIndexBuffer(2,ExtMapBuffer3);
   SetIndexEmptyValue(2,0.0);
   SetIndexLabel(2,"signalup");


   SetIndexStyle(3,DRAW_ARROW);
   SetIndexArrow(3,159);
   SetIndexBuffer(3,ExtMapBuffer4);
   SetIndexEmptyValue(3,0.0);
   SetIndexLabel(3,"signaldown");

   SetIndexStyle(4,DRAW_HISTOGRAM);
   SetIndexArrow(4,159);
   SetIndexBuffer(4,ExtMapBuffer5);
   SetIndexEmptyValue(4,0.0);
   SetIndexLabel(4,"downline");

   SetIndexStyle(5,DRAW_HISTOGRAM);
   SetIndexArrow(5,159);
   SetIndexBuffer(5,ExtMapBuffer6);
   SetIndexEmptyValue(5,0.0);
   SetIndexLabel(5,"downline");

   SetIndexStyle(6,DRAW_HISTOGRAM);
   SetIndexArrow(6,159);
   SetIndexBuffer(6,ExtMapBuffer7);
   SetIndexEmptyValue(6,0.0);
   SetIndexLabel(6,"signal");

   SetIndexStyle(7,DRAW_HISTOGRAM);
   SetIndexArrow(7,159);
   SetIndexBuffer(7,ExtMapBuffer8);
   SetIndexEmptyValue(7,0.0);
   SetIndexLabel(7,"signal");


   IndicatorShortName("!!DailyPivot"+GrossPeriod);
//----
//----
   if (Period()>GrossPeriod) {GrossPeriod=Period();}

   ArrayCopySeries(daytimes,MODE_TIME,Symbol(),GrossPeriod);
   return(0);
  }
//+------------------------------------------------------------------+
//| Custor indicator deinitialization function                       |
//+------------------------------------------------------------------+
int deinit()
  {
//----

//----
   return(0);
  }
//+------------------------------------------------------------------+
//| Custom indicator iteration function                              |
//+------------------------------------------------------------------+
int start()
  {
   int    counted_bars=IndicatorCounted();
   int    limit,bigshift;
   double value1,value2,value3,value4;
   if (counted_bars<0) return(-1);

   if (counted_bars>0) counted_bars--;
   if (Barss>0) limit=Bars-Barss-counted_bars; else limit=Bars-counted_bars;
//----
   for (int i=0; i<limit; i++)
   {
   if(Time[i]>=daytimes[0]) bigshift=0;
   else
     {
      bigshift = ArrayBsearch(daytimes,Time[i-1],WHOLE_ARRAY,0,MODE_DESCEND);
      if(Period()<=GrossPeriod) bigshift++;
     }
      for (int cnt=bigshift; cnt<(1+bigshift); cnt++)
      {
         value1=iMA(NULL,GrossPeriod,1,1,MODE_SMMA,PRICE_MEDIAN,cnt);
      }

   if((Close[i]-value1)/Point>=0)
      {
      ExtMapBuffer1[i]=High[i];
      ExtMapBuffer2[i]=Low[i];
      ExtMapBuffer3[i]=value1;

      }
         else
            {
            ExtMapBuffer1[i]=0;
            ExtMapBuffer2[i]=0;
            ExtMapBuffer3[i]=0;
            ExtMapBuffer4[i]=0;
            }
   if((Close[i]-value1)/Point<0)
      {
      ExtMapBuffer5[i]=High[i];
      ExtMapBuffer6[i]=Low[i];
      ExtMapBuffer4[i]=value1;
      }
         else
            {
            ExtMapBuffer5[i]=0;
            ExtMapBuffer6[i]=0;
            ExtMapBuffer7[i]=0;
            ExtMapBuffer8[i]=0;
            }
   ObjectsRedraw();
   RefreshRates();


   }
//----
   return(0);
  }
//+------------------------------------------------------------------+
Comments