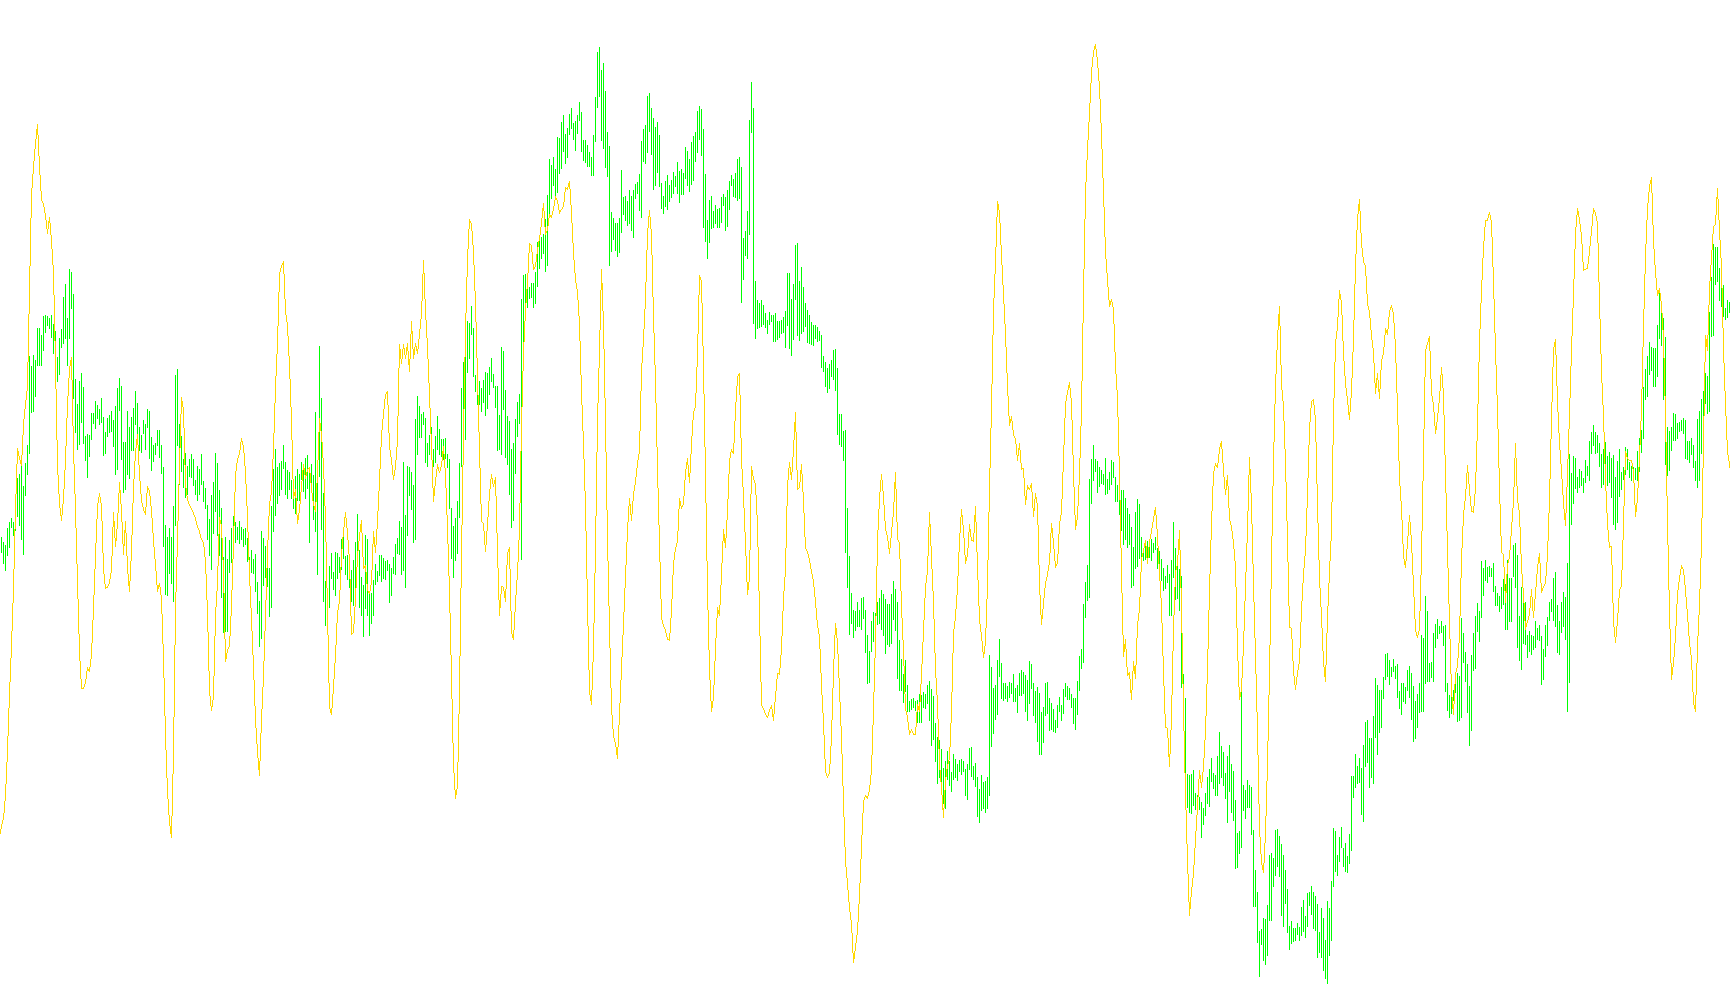
This tool is designed to provide traders with a smoothed, more readable version of the Relative Strength Index (RSI), which is a common momentum oscillator used to identify overbought or oversold conditions in the market. By combining two different technical analysis methods, the script helps filter out "market noise" and provides a clearer picture of price momentum.
How the Logic Works
The script operates in a two-step sequence to process market data:
1. Momentum Calculation (RSI) First, the tool calculates the standard RSI based on a specific number of previous price bars. The RSI measures the speed and change of price movements; high values typically suggest that an asset is overextended to the upside, while low values suggest it is overextended to the downside.
2. Smoothing the Data (Moving Average) Instead of showing you the raw, often jagged RSI line—which can fluctuate rapidly and lead to false signals—this script applies a Moving Average calculation directly onto the RSI results. Essentially, it takes the "average of the averages." This process smooths out the curves, making the trend of the momentum easier to visualize.
Key Features and Visuals
- Visual Clarity: The resulting data is displayed in a separate window on your chart as a continuous line. The gold coloring helps distinguish the smoothed trend from other indicators.
- Reference Levels: The script includes several predefined horizontal levels (such as 45, 50, 55, and 90). These serve as visual benchmarks to help you identify when the smoothed momentum is entering extreme zones or shifting its central direction.
- Customizable Sensitivity: The logic allows you to adjust the "Period" for both the RSI and the Moving Average. By increasing these numbers, you can make the indicator slower and smoother; by decreasing them, you can make it more responsive to rapid price changes.
In summary, this script is designed for traders who prefer a "cleaner" look at momentum. It takes the raw volatility of the RSI and tames it with a moving average, allowing for a more stable view of whether the market is gaining strength or losing steam.
//+------------------------------------------------------------------+
//|                                                       MA_RSI.mq4 |
//|                                                  Alexei Parvatkin|
//|                                                  alexpar@list.ru |
//+------------------------------------------------------------------+
#property copyright "2009. Alexei Parvatkin. Togliatti"
#property link      "e-mail: alexpar@list.ru"

#property indicator_separate_window
#property indicator_buffers 1
#property indicator_color1 Gold
#property indicator_level1 50
#property indicator_level2 90
#property indicator_level3 10
#property indicator_level4 45
#property indicator_level5 55
#property indicator_maximum 100
#property indicator_minimum 0
//---- input parameters

extern int RSI_Period= 5;
extern int RSI_Mode=0;
extern int  MA_Period=5;
extern int  MA_Mode  =0;
extern int Limit=5440;


double RSI[];
double MA[];
//+------------------------------------------------------------------+
//| Custom indicator initialization function                         |
//+------------------------------------------------------------------+
int init() {
   IndicatorBuffers(2);
   SetIndexStyle(0,DRAW_LINE);
   SetIndexDrawBegin(0,RSI_Period+MA_Period);
   SetIndexBuffer(0,MA);
   SetIndexBuffer(1,RSI);
   IndicatorShortName("MA_RSI("+RSI_Period+","+MA_Period+")");
   SetIndexLabel(0,"MA(WPR)");

   return(0); }

//+------------------------------------------------------------------+
int start() {
   int limit;
   int counted_bars=IndicatorCounted();
   int i;

   if(counted_bars<0) return(-1);
   if(counted_bars>0) counted_bars--;
   limit=Bars-counted_bars;
   if (limit>Limit && Limit>0) limit = Limit;
   for (i = limit;i>=0;i--) RSI[i] = iRSI(Symbol(),Period(),RSI_Period,RSI_Mode,i);
   for (i = limit;i>=0;i--) MA[i] = iMAOnArray(RSI,0,MA_Period,0,MA_Mode,i);
   return(0);
}// int start()
Comments