VininI_MA_WPR(v1)
Download script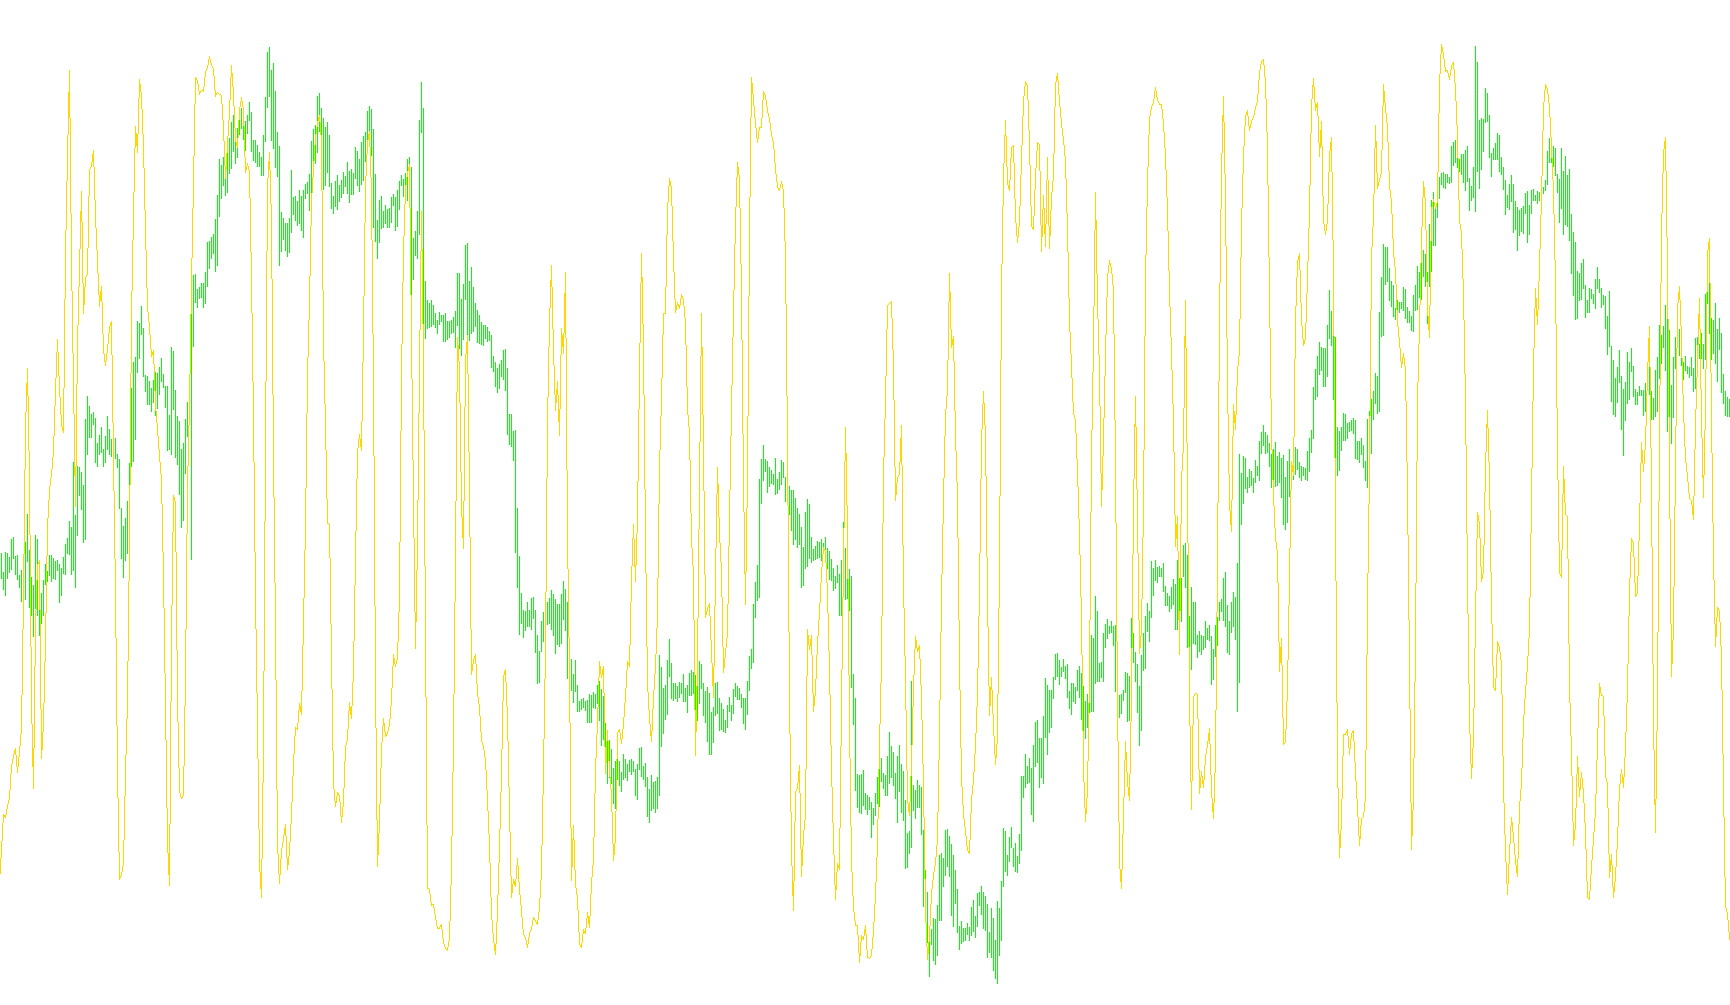
This tool is designed to help traders visualize and smooth out market momentum by combining two different types of technical analysis into a single visual indicator. Instead of looking at raw price movements, it focuses on the "speed" and "strength" of the market's trend.
How the Logic Works
The script operates in three distinct steps to transform raw data into a readable signal:
1. Calculating Momentum (The Williams Percent Range) First, the tool looks at the Williams Percent Range (WPR). This is a standard technical indicator used to determine whether a market is overbought or oversold by looking at where the current price sits relative to its high and low range over a specific timeframe.
2. Scaling the Data By default, the Williams Percent Range moves between -100 and +100. To make this data easier for human eyes to interpret and more compatible with standard charting styles, the script performs a mathematical transformation. It shifts the values so they center around a "zero" baseline and scales them accordingly. This allows you to see the market's sentiment as a wave moving above or below a central point.
3. Smoothing the Signal (The Moving Average) Raw momentum data can often be "noisy," meaning it can jump up and down erratically, making it difficult to see the actual trend. To solve this, the script applies a Moving Average to the processed momentum data. Think of this like a "smoothing filter"—it takes the recent history of the momentum and calculates an average to create a fluid, continuous line.
Summary for the Trader
Instead of watching jagged spikes in price, this indicator provides a smoother, more stable line on your chart. It tells you:
- Direction: Whether the current momentum is pushing upward or downward.
- Strength: How aggressively the market is moving in that direction.
- Trend Clarity: Because it uses a smoothing average, it helps filter out minor "market noise," allowing you to see the broader trend of the price action more clearly.
//+------------------------------------------------------------------+
//|                                             VininI_MA_WPR.v1.mq4 |
//|                                         Victor Nicolaev aka Vinin|
//|                                                    vinin@mail.ru |
//+------------------------------------------------------------------+
#property copyright "2008. Victor Nicolaev aka Vinin"
#property link      "e-mail: vinin@mail.ru"

#property indicator_separate_window
#property indicator_buffers 1
#property indicator_color1 Aqua
#property indicator_level1 0
#property indicator_level2 60
#property indicator_level3 -60

#property indicator_maximum 100
#property indicator_minimum -100
//---- input parameters

extern int WPR_Period= 14;
extern int  MA_Period=3;
extern int Limit=1440;
int  MA_Mode  =0;

double WPR[];
double MA[];
//+------------------------------------------------------------------+
//| Custom indicator initialization function                         |
//+------------------------------------------------------------------+
int init() {
   IndicatorBuffers(2);
   SetIndexStyle(0,DRAW_LINE);
   SetIndexDrawBegin(0,WPR_Period+MA_Period);
   SetIndexBuffer(0,MA);
   SetIndexBuffer(1,WPR);
   IndicatorShortName("MA_WPR("+WPR_Period+","+MA_Period+")");
   SetIndexLabel(0,"MA(WPR)");

   return(0); }

//+------------------------------------------------------------------+
int start() {
   int limit;
   int counted_bars=IndicatorCounted();
   int i;

   if(counted_bars<0) return(-1);
   if(counted_bars>0) counted_bars--;
   limit=Bars-counted_bars;
   if (limit>Limit && Limit>0) limit = Limit;
   for (i = limit;i>=0;i--) WPR[i] = (iWPR(Symbol(),Period(),WPR_Period,i)+50.0)*2.0;
   for (i = limit;i>=0;i--) MA[i] = iMAOnArray(WPR,0,MA_Period,0,MA_Mode,i);
   return(0);
}// int start()
Comments