MACD-Crossover_Signal
Download script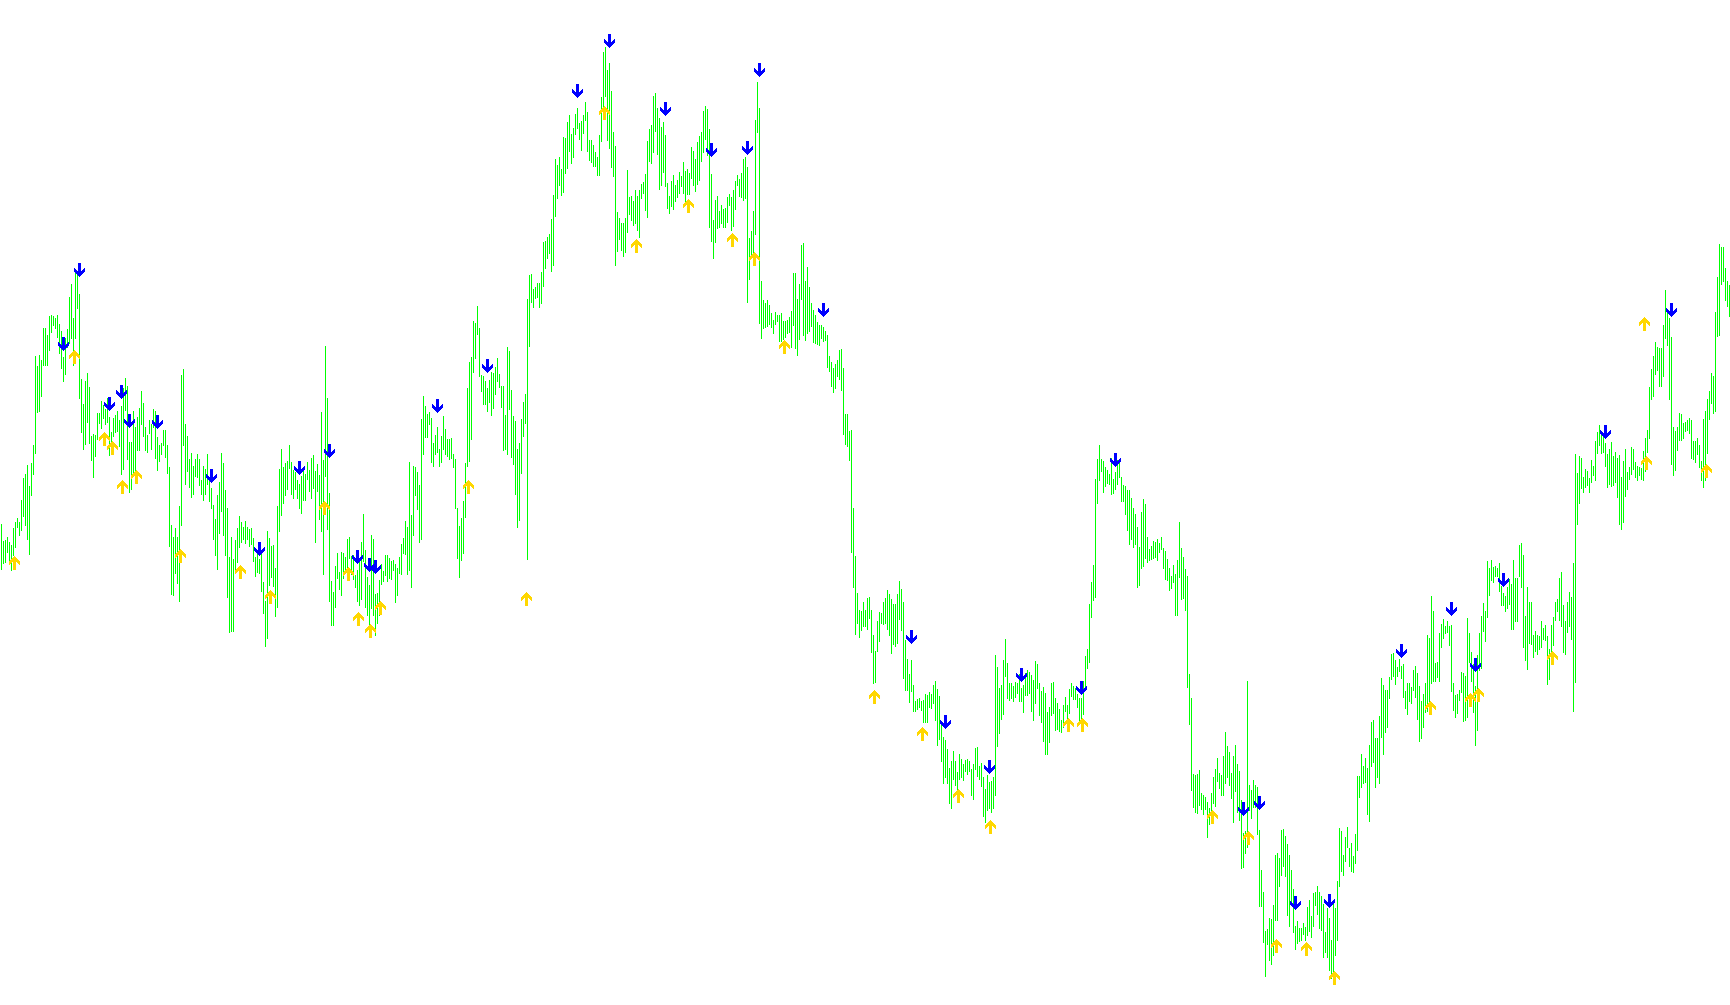
This tool is designed to serve as a visual aid for traders by automatically identifying specific momentum shifts in the market. Instead of requiring you to constantly monitor complex moving lines, it simplifies the data into clear visual cues directly on your price chart.
How the Logic Works
The script operates by analyzing the relationship between two primary components of the MACD (Moving Average Convergence Divergence) indicator: the Main Line and the Signal Line.
To determine when to place a signal, the tool looks for "crossovers"—moments where these two lines intersect. These intersections are significant because they often suggest a change in the market's trend direction.
Identifying Upward Momentum (Buy Signals)
The script constantly monitors whether the Main Line is moving upward relative to the Signal Line. A signal is triggered when:
- In the previous moment, the Signal Line was above the Main Line.
- In the current moment, the Main Line has crossed above the Signal Line.
When this happens, the tool places a green arrow below the price candle to highlight a potential shift toward upward momentum.
Identifying Downward Momentum (Sell Signals)
Conversely, the script looks for the opposite behavior to identify cooling trends or downward moves. A signal is triggered when:
- In the previous moment, the Signal Line was below the Main Line.
- In the current moment, the Signal Line has crossed above the Main Line.
When this occurs, the tool places a red arrow above the price candle to alert you to a potential shift toward downward momentum.
Dynamic Visual Placement
To ensure the signals are easy to read and do not clutter the actual price candles, the script includes a smart positioning logic. It calculates the average "range" (the height of the price candles) over the last 10 periods. It then uses this calculation to offset the arrows slightly above or below the candles. This ensures that the signals remain clearly visible regardless of whether the market is moving in small increments or experiencing large, volatile swings.
//+------------------------------------------------------------------+
//|                                        MACD-Crossover_Signal.mq4 |
//+------------------------------------------------------------------+

#property copyright "Copyright © 2007, Robert Hill)"

#property indicator_chart_window
#property indicator_buffers 2
#property indicator_color1 SpringGreen
#property indicator_color2 Red

double CrossUp[];
double CrossDown[];
extern int FastEMA=12;
extern int SlowEMA=26;
extern int SignalSMA=9;
//+------------------------------------------------------------------+
//| Custom indicator initialization function                         |
//+------------------------------------------------------------------+
int init()
  {
//---- indicators
   SetIndexStyle(0, DRAW_ARROW, EMPTY);
   SetIndexArrow(0, 233);
   SetIndexBuffer(0, CrossUp);
   SetIndexStyle(1, DRAW_ARROW, EMPTY);
   SetIndexArrow(1, 234);
   SetIndexBuffer(1, CrossDown);
//----
   return(0);
  }
//+------------------------------------------------------------------+
//| Custom indicator deinitialization function                       |
//+------------------------------------------------------------------+
int deinit()
  {
//----

//----
   return(0);
  }
//+------------------------------------------------------------------+
//| Custom indicator iteration function                              |
//+------------------------------------------------------------------+
int start() {
   int limit, i, counter;
   double MACD_Main, MACD_Signal, MACD_MainPrevious, MACD_SignalPrevious;
   double Range, AvgRange;
   int counted_bars=IndicatorCounted();
//---- check for possible errors
   if(counted_bars<0) return(-1);
//---- last counted bar will be recounted
   if(counted_bars>0) counted_bars--;

   limit=Bars-counted_bars;

   for(i = 0; i <= limit; i++) {

      counter=i;
      Range=0;
      AvgRange=0;
      for (counter=i ;counter<=i+9;counter++) {
         AvgRange=AvgRange+MathAbs(High[counter]-Low[counter]);
      }
      Range=AvgRange/10;

      MACD_Main = iMACD(NULL, 0, FastEMA, SlowEMA, SignalSMA, PRICE_CLOSE, MODE_MAIN, i);
      MACD_MainPrevious = iMACD(NULL, 0, FastEMA, SlowEMA, SignalSMA, PRICE_CLOSE, MODE_MAIN, i+1);
      MACD_Signal = iMACD(NULL, 0, FastEMA, SlowEMA, SignalSMA, PRICE_CLOSE, MODE_SIGNAL, i);
      MACD_SignalPrevious = iMACD(NULL, 0, FastEMA, SlowEMA, SignalSMA, PRICE_CLOSE, MODE_SIGNAL, i+1);


      if ((MACD_Signal < MACD_Main) && (MACD_SignalPrevious > MACD_MainPrevious)) {
         CrossUp[i] = Low[i] - Range*0.5;
      }
      else if ((MACD_Signal > MACD_Main) && (MACD_SignalPrevious < MACD_MainPrevious)) {
         CrossDown[i] = High[i] + Range*0.5;
      }
   }
   return(0);
}
Comments