MACD_i_
Download script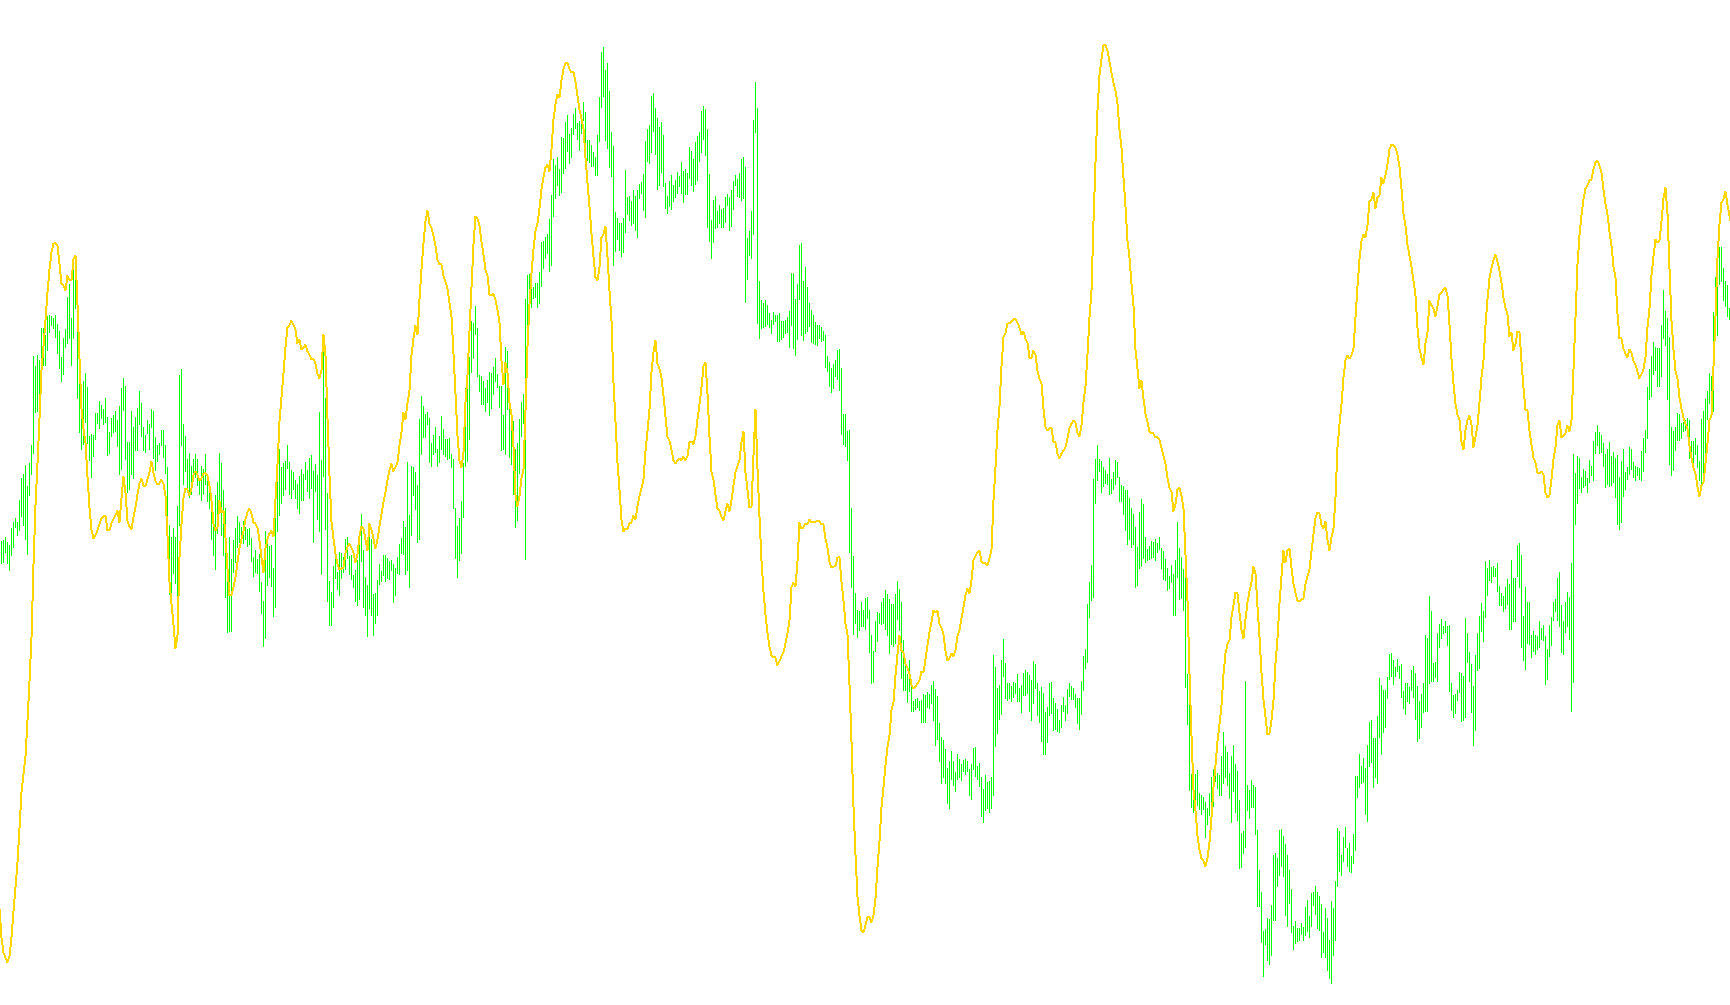
This custom technical indicator is designed to analyze price momentum by measuring the relationship between two different types of moving averages. It provides a visual representation of market trends, helping traders identify whether the price is accelerating, slowing down, or reversing direction.
How the Logic Works
The script operates through a three-step calculation process to produce three distinct visual elements on your trading chart:
1. The MACD Line (Trend Strength) The foundation of this indicator starts by calculating two different averages of the market price:
- A Fast Average: This reacts quickly to recent price changes.
- A Slow Average: This follows the broader, longer-term trend. By subtracting the Slow Average from the Fast Average, the script creates the MACD Line. When this line is above zero, it suggests that short-term momentum is stronger than the long-term trend; when below zero, it suggests the opposite.
2. The Signal Line (Smoothing) To make the data easier to read and to filter out "market noise," the script takes the MACD Line calculated in the first step and applies a secondary moving average to it. This results in the Signal Line. Think of this as a "smoothed" version of the trend momentum, which helps traders identify specific turning points.
3. The Histogram (The Gap) Finally, the script calculates the difference between the MACD Line and the Signal Line. This difference is displayed as a Histogram.
- The bars on the histogram grow taller or deeper based on how far apart the two lines are.
- This visual tool helps highlight the intensity of a trend—large bars indicate significant momentum, while shrinking bars can signal that the current move is losing steam.
Summary of Visual Outputs
- Line 1 (MACD): Shows the raw difference between fast and slow price movements.
- Line 2 (Signal): A smoothed path used to identify potential entry or exit points based on crossovers.
- Histogram: A vertical bar graph that highlights the "distance" between the trend and the signal, providing a quick glance at current market volatility and strength.
//+------------------------------------------------------------------+
//|                                                  Custom MACD.mq4 |
//|                      Copyright © 2004, MetaQuotes Software Corp. |
//|                                       http://www.metaquotes.net/ |
//+------------------------------------------------------------------+
#property  copyright "Copyright © 2005, Doji Starr"
//---- indicator settings
#property  indicator_separate_window
#property  indicator_buffers 3
#property  indicator_color1  Indigo
#property  indicator_color2  Red
#property  indicator_color3  Silver
//---- indicator parameters
extern int FastEMA=12;
extern int SlowEMA=26;
extern int SignalSMA=9;
//---- indicator buffers
double     ind_buffer1[];
double     ind_buffer2[];
double     ind_buffer3[];

//+------------------------------------------------------------------+
//| Custom indicator initialization function                         |
//+------------------------------------------------------------------+
int init()
  {
//---- drawing settings
   SetIndexStyle(0,DRAW_LINE,STYLE_SOLID,2);
   SetIndexStyle(2,DRAW_HISTOGRAM,STYLE_SOLID,3);
   SetIndexDrawBegin(1,SignalSMA);
   IndicatorDigits(MarketInfo(Symbol(),MODE_DIGITS)+1);
//---- indicator buffers mapping
   if(!SetIndexBuffer(0,ind_buffer1) && !SetIndexBuffer(1,ind_buffer2) && !SetIndexBuffer(2,ind_buffer3))
      Print("cannot set indicator buffers!");
//---- name for DataWindow and indicator subwindow label
   IndicatorShortName("_i_MACD("+FastEMA+","+SlowEMA+","+SignalSMA+")");
   SetIndexLabel(0,"MACD");
   SetIndexLabel(1,"Signal");
   SetIndexLabel(2,"Histogram");
//---- initialization done
   return(0);
  }
//+------------------------------------------------------------------+
//| Moving Averages Convergence/Divergence                           |
//+------------------------------------------------------------------+
int start()
  {
   int limit;
   int counted_bars=IndicatorCounted();
//---- check for possible errors
   if(counted_bars<0) return(-1);
//---- last counted bar will be recounted
   if(counted_bars>0) counted_bars--;
   limit=Bars-counted_bars;
//---- macd counted in the 1-st buffer
   for(int i=0; i<limit; i++)
      ind_buffer1[i]=iMA(NULL,0,FastEMA,0,MODE_EMA,PRICE_CLOSE,i)-iMA(NULL,0,SlowEMA,0,MODE_EMA,PRICE_CLOSE,i);
//---- signal line counted in the 2-nd buffer
   for(i=0; i<limit; i++)
      ind_buffer2[i]=iMAOnArray(ind_buffer1,Bars,SignalSMA,0,MODE_SMA,i);
//---- difference counted in the 3-rd buffer
   for(i=0; i<limit; i++)
      ind_buffer3[i]=ind_buffer1[i]-ind_buffer2[i];
//---- done
   return(0);
  }
Comments