JMA_MACD
Download script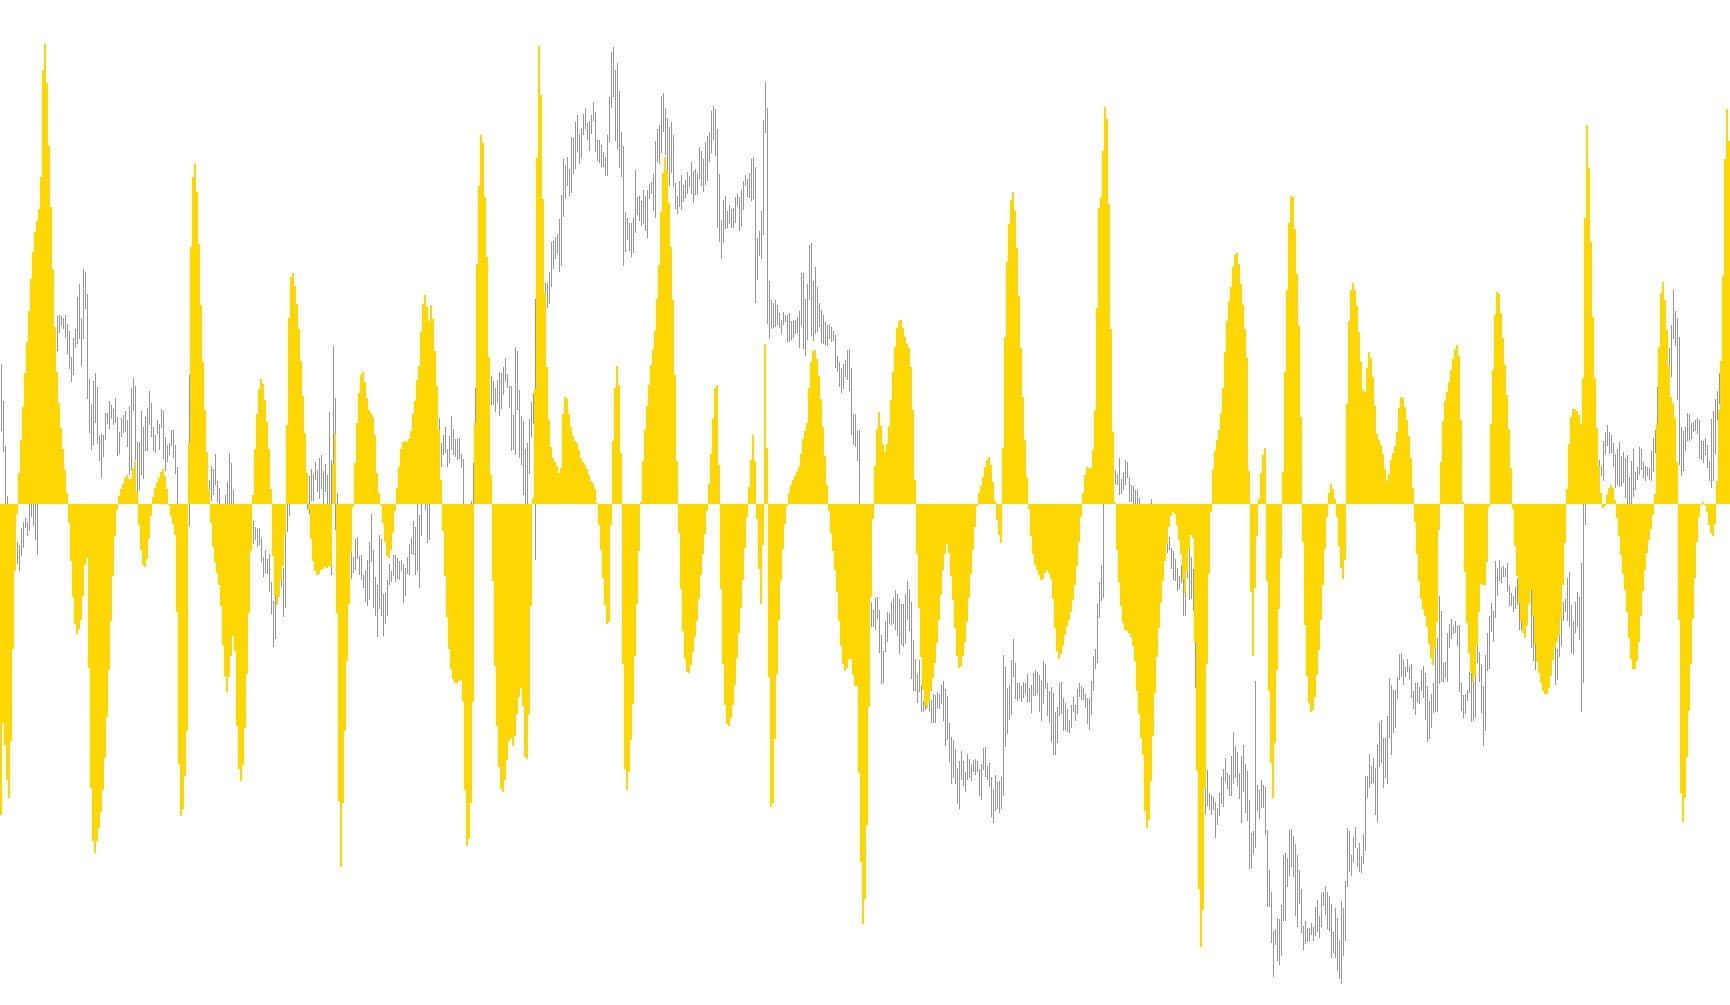
This tool is a specialized technical analysis indicator designed to help traders identify momentum and potential trend reversals in the financial markets. By combining two distinct mathematical concepts—the Jurik Moving Average (JMA) and the Moving Average Convergence Divergence (MACD)—it provides a visual representation of how price velocity is shifting over time.
Core Logic Overview
At its heart, this indicator works by comparing two different "speeds" of price movement. It takes a fast-moving data stream and subtracts a slower-moving data stream from it. The resulting difference tells the trader whether the market is accelerating in one direction or slowing down.
Instead of using standard moving averages, which can often be "laggy" or slow to react to sudden price changes, this tool utilizes the Jurik Moving Average. The Jurik method is renowned for its ability to stay smooth while remaining highly responsive to current price action, making it a sophisticated way to filter out market noise.
How the Data Is Processed
The indicator performs three primary actions to generate its visual output:
- Fast Momentum Tracking: It calculates a fast-paced Jurik Moving Average based on a short period (defaulting to 12 periods). This represents the immediate, "noisy" direction of the price.
- Slow Momentum Tracking: It calculates a slower Jurik Moving Average based on a longer period (defaulting to 26 periods). This represents the broader, long-term trend.
- The MACD Calculation: The tool subtracts the slow average from the fast average. In your trading window, this is shown as a histogram. When the histogram is above zero, it generally suggests bullish momentum; when below zero, it suggests bearish momentum.
The Signal Line
To further refine the data and prevent traders from jumping into trades too early, the tool includes a Signal Line.
The script takes the results of the MACD calculation and applies a Simple Moving Average (SMA) to that data. This acts as a "smoothing" layer over the histogram. When the main histogram crosses this signal line, it often serves as a secondary confirmation point, helping traders distinguish between a temporary price flicker and a sustained shift in market sentiment.
Summary for the Trader
In plain terms, this script cleans up the "messy" movements of a price chart to show you the underlying strength of a trend. It helps you see not just where the price is going, but how fast it is moving there, providing a clearer picture of momentum by balancing smoothness with responsiveness.
//+------------------------------------------------------------------+
//|                                                  JMA_MACD.mq4 |
//|                      Copyright © 2004, MetaQuotes Software Corp. |
//|                                       http://www.metaquotes.net/ |
//+------------------------------------------------------------------+
#property  copyright "Copyright © 2005, scorpion."
#property  link      "http://www.fxfisherman.com/"
//---- indicator settings
#property  indicator_separate_window
#property  indicator_buffers 2
#property  indicator_color1  Silver
#property  indicator_color2  Red
//---- indicator parameters
extern int FastJMA=12;
extern int SlowJMA=26;
extern int SignalSMA=9;
extern int FastJMAPhrase=0;
extern int SlowJMAPhrase=0;
//---- indicator buffers
double     ind_buffer1[];
double     ind_buffer2[];

//+------------------------------------------------------------------+
//| Custom indicator initialization function                         |
//+------------------------------------------------------------------+
int init()
  {
//---- drawing settings
   SetIndexStyle(0,DRAW_HISTOGRAM,STYLE_SOLID,3);
   SetIndexDrawBegin(1,SignalSMA);
   IndicatorDigits(MarketInfo(Symbol(),MODE_DIGITS)+1);
//---- indicator buffers mapping
   if(!SetIndexBuffer(0,ind_buffer1) && !SetIndexBuffer(1,ind_buffer2))
      Print("cannot set indicator buffers!");
//---- name for DataWindow and indicator subwindow label
   IndicatorShortName("JMA MACD("+FastJMA+","+SlowJMA+","+SignalSMA+")");
   SetIndexLabel(0,"JMAMACD");
   SetIndexLabel(1,"Signal");
//---- initialization done
   return(0);
  }
//+------------------------------------------------------------------+
//| Moving Averages Convergence/Divergence                           |
//+------------------------------------------------------------------+
int start()
  {
   int limit;
   int counted_bars=IndicatorCounted();
//---- check for possible errors
   if(counted_bars<0) return(-1);
//---- last counted bar will be recounted
   if(counted_bars>0) counted_bars--;
   limit=Bars-counted_bars;
//---- macd counted in the 1-st buffer
   for(int i=0; i<limit; i++)
      ind_buffer1[i]= iCustom(NULL,0,"JMA",FastJMA,FastJMAPhrase,0,i) - iCustom(NULL,0,"JMA",SlowJMA,SlowJMAPhrase,0,i);
      //ind_buffer1[i]=iMA(NULL,0,FastEMA,0,MODE_EMA,PRICE_CLOSE,i)-iMA(NULL,0,SlowEMA,0,MODE_EMA,PRICE_CLOSE,i);
//---- signal line counted in the 2-nd buffer
   for(i=0; i<limit; i++)
      ind_buffer2[i]=iMAOnArray(ind_buffer1,Bars,SignalSMA,0,MODE_SMA,i);
//---- done
   return(0);
  }
Comments