macd_x2MTF
Download script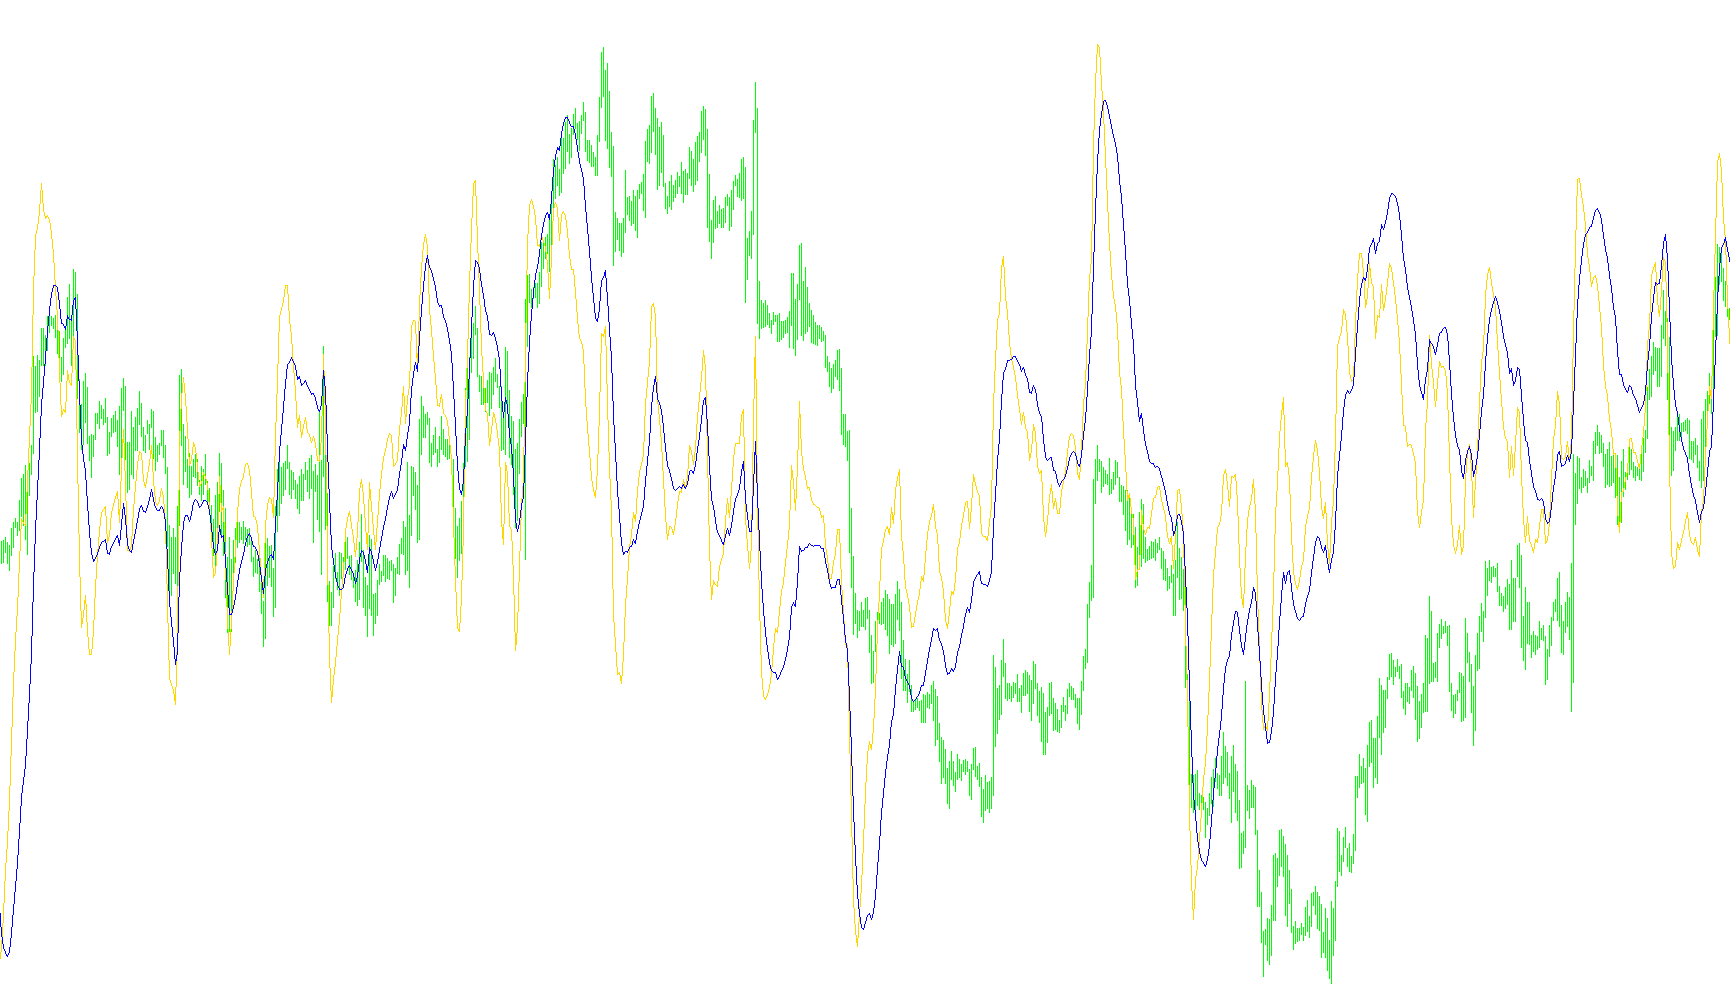
This script is designed to function as a specialized visual tool for the MetaTrader platform, specifically created to help traders analyze price momentum and trend direction. Instead of displaying on the main price chart, it occupies its own separate window, allowing you to monitor two distinct sets of technical data simultaneously.
Core Functionality
The primary logic of this script involves calculating and overlaying two different "MACD" (Moving Average Convergence Divergence) indicators at once. While a standard MACD helps identify whether a trend is strengthening or weakening, this tool allows for a dual-layered approach. By viewing two sets of these calculations side-by-side, users can compare different speeds of market movement—for example, observing fast-moving price fluctuations against slower, more stable long-term trends.
How it Processes Data
The script performs several specific actions to organize this information for the user:
- Multi-Timeframe Analysis: One of the key features is its ability to reference data from different timeframes. It can pull information from a higher timeframe and project it onto your current chart, helping you see the "big picture" without switching windows.
- Customizable Smoothing: The script uses adjustable settings for three main components: the fast moving average, the slow moving average, and the signal line for both indicators. This means it can be tuned to react quickly to price changes or more slowly to filter out market noise.
- Selection Modes: For each of the two indicators displayed, the user can choose whether to view the "main" trend line or the "signal" line. This flexibility allows for a highly customized visual workspace depending on the specific trading strategy being employed.
Visual Output
The result is a clean, dual-line display in a separate sub-window. Each indicator is assigned a specific color (LightSeaGreen and Green), making it easy to distinguish between the two different data sets at a glance. By calculating these values based on closing prices, the script provides a streamlined look at the underlying momentum of the asset you are currently trading.
//+------------------------------------------------------------------+
//|                                                          CCI.mq4 |
//|                      Copyright © 2004, MetaQuotes Software Corp. |
//|                                       http://www.metaquotes.net/ |
//+------------------------------------------------------------------+
//2009fxtsd
#property copyright "Copyright © 2004, MetaQuotes Software Corp."
#property link      "http://www.metaquotes.net/"
//----
#property indicator_separate_window
#property indicator_buffers 2
#property indicator_color1 LightSeaGreen
#property indicator_color2 Green

//---- input parameters
extern int macd1MAfast =5;
extern int macd1MAslow =13;
extern int macd1SigMA  =5;

extern int macd2MAfast =12;
extern int macd2MAslow =26;
extern int macd2SigMA  =9;

extern int macd1LnMode=0; //0main,1sig
extern int macd2LnMode=0; //0main,1sig


extern int TimeFrame = 0;

//---- buffers
double buffer1[];
double buffer2[];

//+------------------------------------------------------------------+
//| Custom indicator initialization function                         |
//+------------------------------------------------------------------+

int init()
  {

//---- indicator lines
   SetIndexBuffer(0, buffer1);
   SetIndexBuffer(1, buffer2);
//----
//----
   TimeFrame=MathMax(TimeFrame,Period());

//---- name for DataWindow and indicator subwindow label
   string name1= " macd1 ("+macd1MAfast+","+macd1MAslow+","+macd1SigMA+") ";
   string name2= " macd2 ("+macd2MAfast+","+macd2MAslow+","+macd2SigMA+") ";

   IndicatorShortName(name1+name2+TimeFrame);
   SetIndexLabel(0, name1);
   SetIndexLabel(1, name2);


//----
   return(0);
  }
//+------------------------------------------------------------------+
//| Commodity Channel Index                                          |
//+------------------------------------------------------------------+
int start()
  {
   datetime TimeArray[];
   int    i,shift,limit,y=0,counted_bars=IndicatorCounted();

// Plot defined timeframe on to current timeframe
   ArrayCopySeries(TimeArray,MODE_TIME,Symbol(),TimeFrame);

   limit=Bars-counted_bars+TimeFrame/Period();
   for(i=0,y=0;i<limit;i++)
   {
   if (Time[i]<TimeArray[y]) y++;
//---- main loop
    buffer1[i]=iMACD(NULL,TimeFrame,macd1MAfast,macd1MAslow,macd1SigMA,PRICE_CLOSE,macd1LnMode,y);
    buffer2[i]=iMACD(NULL,TimeFrame,macd2MAfast,macd2MAslow,macd2SigMA,PRICE_CLOSE,macd2LnMode,y);


   }
return(0);
  }
Comments