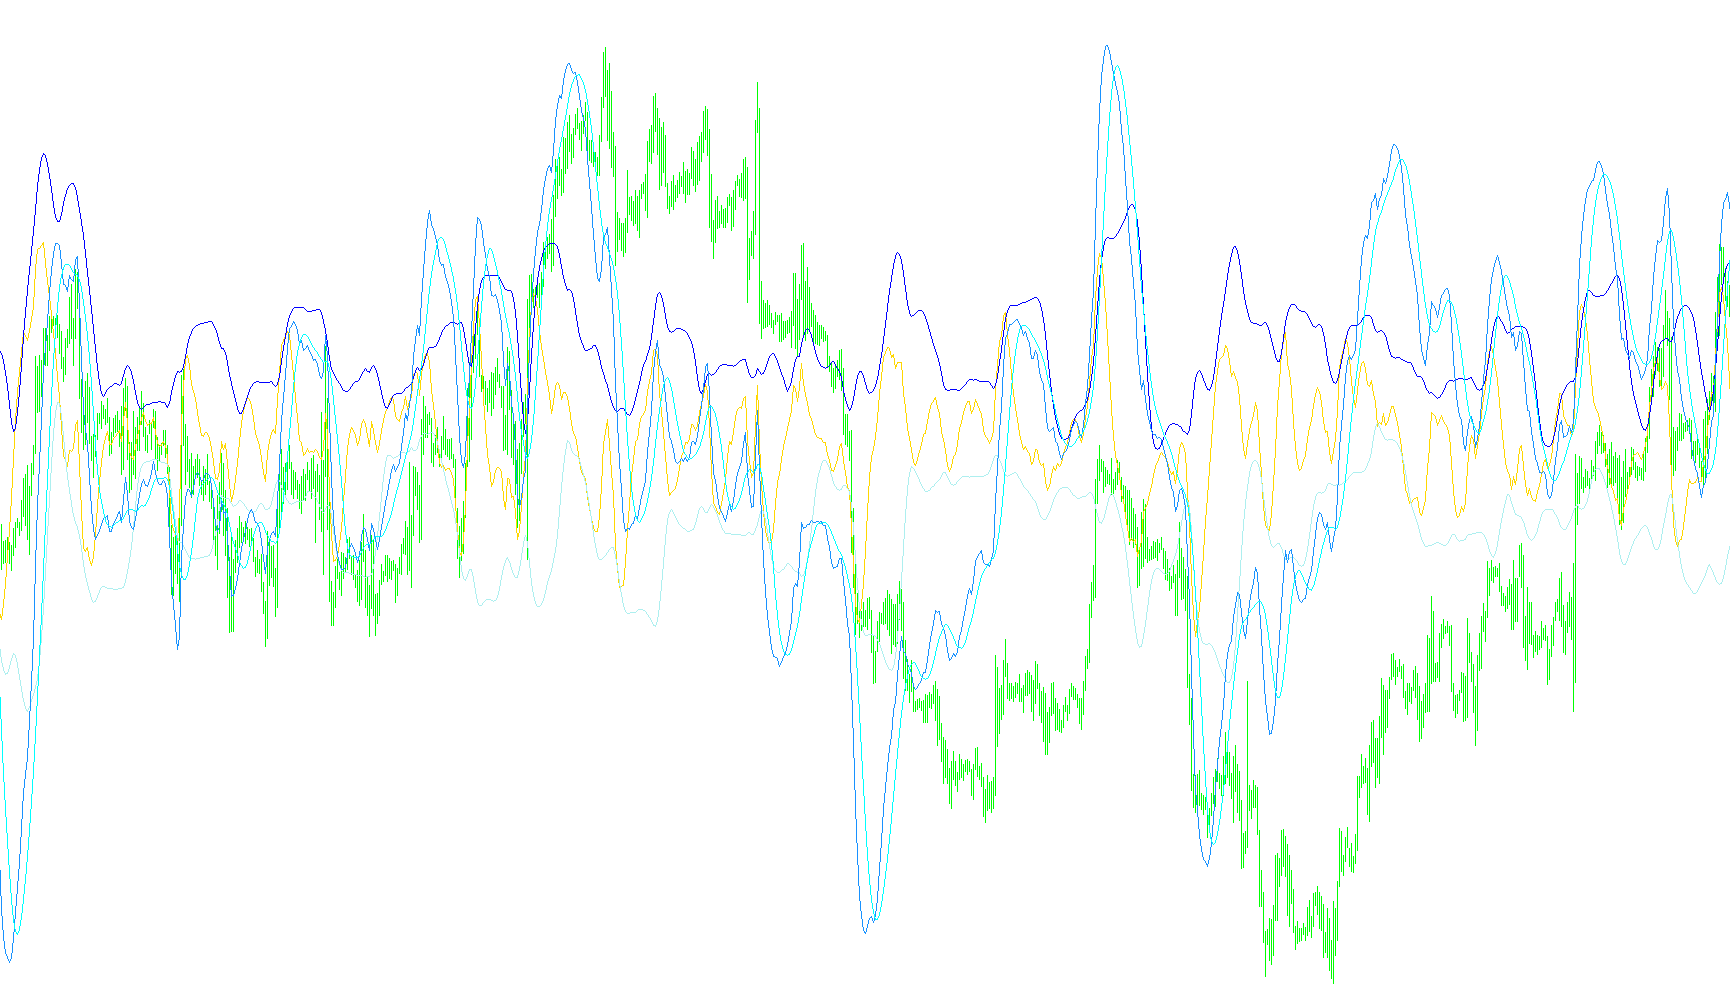
This tool is designed to provide traders with a more comprehensive view of market momentum by layering different mathematical models over the standard MACD (Moving Average Convergence Divergence) indicator. Instead of relying on a single data point, it creates a multi-layered analysis that helps identify trend strength and potential price extremes.
Core Logic Overview
The script operates in three distinct stages to process market data:
1. Base Momentum Calculation The tool starts by analyzing the relationship between two different moving averages—one "fast" and one "slow." By comparing these, it identifies the underlying direction of the market. It then calculates the "MACD line," which represents the immediate distance between these two averages, and a "Signal line," which smooths out that data to help identify shifts in momentum.
2. Dynamic Volatility Bands Unlike standard indicators that just show lines, this script applies Bollinger Bands directly onto the MACD values. This is a sophisticated approach because it creates an "envelope" around the momentum.
- Upper and Lower Boundaries: These bands define the expected range for the momentum.
- Significance: When the momentum moves outside of these boundaries, it can signal that the current move is becoming overextended or "overbought/oversold" relative to its recent history.
3. Signal Smoothing Finally, the script calculates an additional smoothed average of the difference between the fast and slow moving averages. This acts as a secondary confirmation layer, helping to filter out market "noise" and making it easier to see the primary trend of the momentum.
Summary for the Trader
In practical terms, this script doesn't just tell you if the price is going up or down; it visualizes how strong that movement is. By combining momentum (MACD), volatility (Bollinger Bands), and smoothing (Moving Averages) into one visual display, it allows you to see:
- The current trend direction.
- Whether the current move is reaching an extreme point (via the bands).
- The stability of the current momentum compared to recent price action.
//+------------------------------------------------------------------+
//|                                                     macdHelp.mq4 |
//|                                                                  |
//|                                                                  |
//+------------------------------------------------------------------+
#property copyright ""
#property link      ""

#property indicator_separate_window
#property indicator_buffers 5
#property indicator_color1 Red
#property indicator_color2 Red
#property indicator_color3 Red
#property indicator_color4 Red
#property indicator_color5 Red
//---- buffers
double ExtMapBuffer0[];
double ExtMapBuffer1[];
double ExtMapBuffer2[];
double ExtMapBuffer3[];
double ExtMapBuffer4[];

extern int FastEMA=12;
extern int SlowEMA=26;
extern int SignalSMA=9;
extern int BollingerPeriod=21;
extern int BollingerDeviation=2;
extern int BollingerShift=0;

int i;
//+------------------------------------------------------------------+
//| Custom indicator initialization function                         |
//+------------------------------------------------------------------+
int init()
  {
//---- indicators
   SetIndexStyle(0,DRAW_LINE);
   SetIndexBuffer(0,ExtMapBuffer0);
   SetIndexStyle(1,DRAW_LINE);
   SetIndexBuffer(1,ExtMapBuffer1);
   SetIndexStyle(2,DRAW_LINE);
   SetIndexBuffer(2,ExtMapBuffer2);
   SetIndexStyle(3,DRAW_LINE);
   SetIndexBuffer(3,ExtMapBuffer3);
   SetIndexStyle(4,DRAW_LINE);
   SetIndexBuffer(4,ExtMapBuffer4);
//----
   return(0);
  }
//+------------------------------------------------------------------+
//| Custom indicator deinitialization function                       |
//+------------------------------------------------------------------+
int deinit()
  {
//----

//----
   return(0);
  }
//+------------------------------------------------------------------+
//| Custom indicator iteration function                              |
//+------------------------------------------------------------------+
int start()
{
      int limit,
          counted_bars=IndicatorCounted();

   if(counted_bars>0)
      counted_bars--;

   limit=Bars-counted_bars;

   for(i=0;i<limit;i++)
   {
      ExtMapBuffer0[i]=iOsMA(NULL,0,FastEMA,SlowEMA,SignalSMA,PRICE_CLOSE,i);
      ExtMapBuffer3[i]=iMA(NULL,0,FastEMA,0,MODE_EMA,PRICE_CLOSE,i)-iMA(NULL,0,SlowEMA,0,MODE_EMA,PRICE_CLOSE,i);
   }

   for(i=0;i<limit;i++)
   {
      ExtMapBuffer1[i]=iBandsOnArray(ExtMapBuffer0,Bars,BollingerPeriod,BollingerDeviation,BollingerShift,MODE_UPPER,i);
      ExtMapBuffer2[i]=iBandsOnArray(ExtMapBuffer0,Bars,BollingerPeriod,BollingerDeviation,BollingerShift,MODE_LOWER,i);
      ExtMapBuffer4[i]=iMAOnArray(ExtMapBuffer3,Bars,SignalSMA,0,MODE_SMA,i);

   }
//----
   return(0);
  }
//+------------------------------------------------------------------+
Comments