MACDonRSI
Download script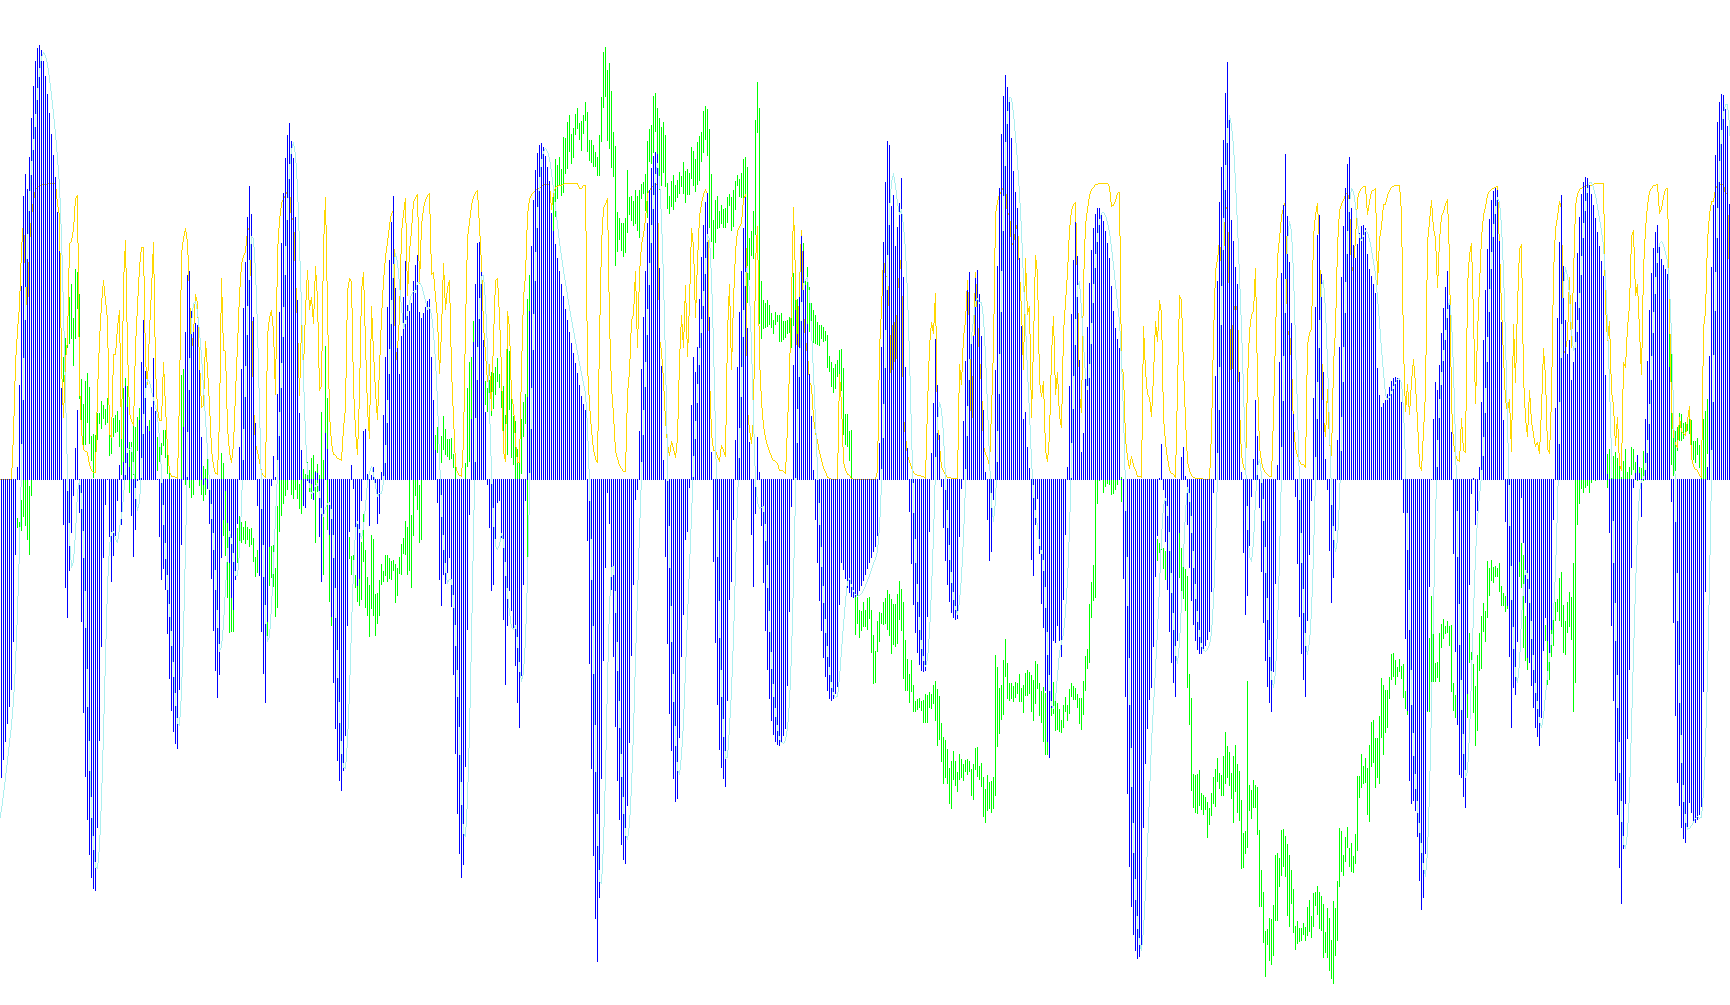
This tool is a custom technical analysis indicator designed to help traders identify market momentum and potential price reversals by combining three well-known financial metrics into a single, multi-layered calculation. Instead of looking at raw price action alone, the logic filters the data through several "smoothing" stages to reduce market noise and highlight underlying trends.
How the Logic Works
The indicator operates through a sequential four-step process where each piece of data feeds into the next:
1. The Base Trend (Moving Average) First, the script identifies a baseline by calculating a Moving Average based on the closing prices of the assets. This acts as the foundation for all subsequent calculations, ensuring that the indicator reacts to the general direction of the market rather than erratic, momentary price spikes.
2. The Strength Filter (RSI) Next, the script applies a Relative Strength Index (RSI) calculation specifically to the Moving Average data identified in the first step. By measuring the relative strength of the trend itself—rather than just the raw price—it helps determine if a specific movement is gaining or losing steam.
3. Momentum Detection (MACD) The script then takes that RSI data and calculates a MACD (Moving Average Convergence Divergence) value. It does this by comparing two different speeds of moving averages (a fast and a slow version). By calculating the difference between these two, the tool highlights where the trend is accelerating or decelerating. This provides a visual "histogram" that shows the velocity of the price movement.
4. The Signal Confirmation Finally, the logic applies one last smoothing layer to the MACD data to create a "Signal Line." By comparing the momentum value against this signal line, traders can more easily identify specific points where the trend might be shifting.
Visual Representation
On your trading chart, the tool provides three distinct visual elements:
- A Main Line: Representing the filtered Relative Strength.
- A Histogram: Visually showing the momentum (MACD) and its strength.
- A Signal Line: A secondary line used to confirm crossovers or shifts in trend direction.
By layering these calculations, the script aims to provide a more "refined" view of the market, filtering out minor fluctuations to focus on the sustained momentum of the price action.
//+------------------------------------------------------------------+
//|                                      		        	 MACDonRSI.mq4 |
//|                                 Copyright © 2008 Ñåðãååâ Àëåêñåé |
//+------------------------------------------------------------------+
#property copyright "Copyright © 2007, Ñåðãååâ Àëåêñåé "
//----
#property indicator_separate_window
#property indicator_buffers 3
#property indicator_color1 LimeGreen
#property indicator_color2 Crimson
#property indicator_color3 Blue
#property indicator_level1 70
#property indicator_level2 30
//----
extern int MA=5;
extern int RSIperiod=3;
extern int FastEMA=10;
extern int SlowEMA=20;
extern int SignalSMA=5;
//----
double BufRSI[];
double BufMACD[];
double BufSign[];
double BufMA[];

int init()
{
//---- indicator line
	IndicatorBuffers(4);
	SetIndexBuffer(0,BufRSI); SetIndexStyle(0,DRAW_LINE);
	SetIndexBuffer(1,BufMACD); SetIndexStyle(1,DRAW_HISTOGRAM);
	SetIndexBuffer(2,BufSign); SetIndexStyle(2,DRAW_LINE);
	SetIndexBuffer(3,BufMA); SetIndexStyle(3,DRAW_NONE);
	return(0);
}

int start()
{
	int i;
	for(i=0; i<Bars; i++) BufMA[i]=iMA(NULL,0,MA,0, MODE_EMA, PRICE_CLOSE, i);
	for(i=0; i<Bars; i++) BufRSI[i]=iRSIOnArray(BufMA,Bars,RSIperiod,i);
	for(i=0; i<Bars; i++) BufMACD[i]=8*(iMAOnArray(BufRSI,Bars,FastEMA,0,MODE_EMA,i)-iMAOnArray(BufRSI,Bars,SlowEMA,0,MODE_EMA,i));
	for(i=0; i<Bars; i++) BufSign[i]=iMAOnArray(BufMACD,Bars,SignalSMA,0,MODE_SMA,i);
	//----
	return(0);
}
//+------------------------------------------------------------------+
Comments