Mint signal2
Download script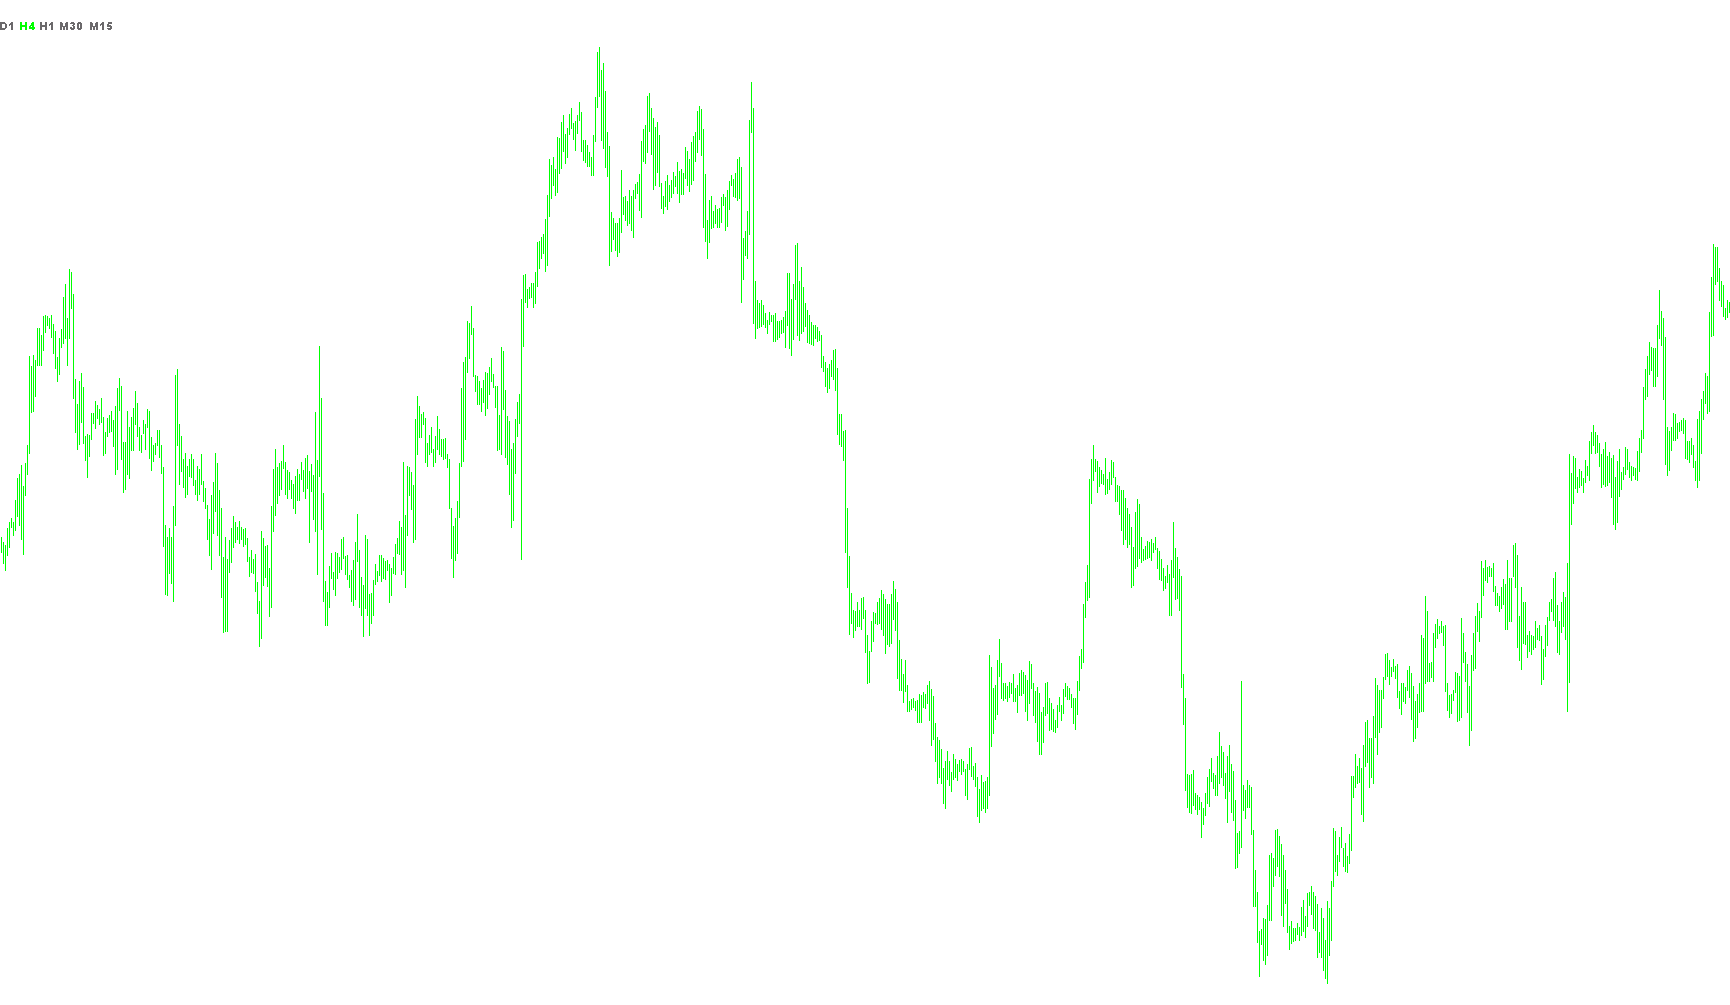
This script functions as a multi-timeframe momentum dashboard designed to provide traders with a real-time visual summary of market trends across five different timeframes simultaneously. Instead of requiring you to switch between charts to see the bigger picture, it aggregates data from several periods into a single, easy-to-read indicator on your current screen.
How It Works
The tool monitors five specific timeframes: Daily (D1), 4-Hour (H4), 1-Hour (H1), 30-Minute (M30), and 15-Minute (M15). For each of these periods, the logic performs a three-step verification process to determine the current market direction:
- Moving Average Crossover: It compares two different types of moving averages—one based on the opening price and one based on the closing price. If the closing price average is trending above the opening price average, it signals bullish (upward) momentum.
- Relative Strength Index (RSI): It checks the RSI to ensure the market's strength is above a neutral midpoint of 50.
- Commodity Channel Index (CCI): It uses the CCI to confirm that the current price is moving significantly higher or lower than its recent average.
Visual Feedback
The script simplifies this complex technical data into a color-coded "Key" displayed on your chart:
- Lime Green: Indicates a strong bullish trend across the specific timeframe. This happens when all three conditions (Moving Average, RSI, and CCI) align to show upward momentum.
- Red: Indicates a strong bearish trend. This occurs when all three conditions align to show downward pressure.
- Dim Gray: Indicates a neutral or "sideways" market. This appears if the indicators are conflicting or if there isn't enough clear momentum to confirm a trend in either direction.
Practical Use
By viewing this dashboard, you can instantly see if the short-term trends (like the 15-minute chart) are aligned with the long-term trends (like the Daily chart). It allows for "top-down" analysis, helping you identify when multiple timeframes are moving in the same direction, which often suggests a higher probability of a sustained market move.
//+------------------------------------------------------------------+
//|                                              Key to the mint.mq4 |
//|                                                   free84@aol.com |
//+------------------------------------------------------------------+

#property link "free84@aol.com"

#property indicator_chart_window

extern int EMA=5;
extern int EMA2=8;
extern int RSIv=13;
extern int CCIv=50;
double dTemp[3,2];

int init()
	{
		ObjectCreate("Dot1",OBJ_LABEL,0,0,0);
		ObjectSet("Dot1",OBJPROP_XDISTANCE,2);
		ObjectSet("Dot1",OBJPROP_YDISTANCE,20);
		ObjectSetText("Dot1","D1",8,"Arial Black",EMPTY_VALUE);

		ObjectCreate("Dot2",OBJ_LABEL,0,0,0);
		ObjectSet("Dot2",OBJPROP_XDISTANCE,22);
		ObjectSet("Dot2",OBJPROP_YDISTANCE,20);
		ObjectSetText("Dot2","H4",8,"Arial Black",EMPTY_VALUE);

		ObjectCreate("Dot3",OBJ_LABEL,0,0,0);
		ObjectSet("Dot3",OBJPROP_XDISTANCE,42);
		ObjectSet("Dot3",OBJPROP_YDISTANCE,20);
		ObjectSetText("Dot3","H1",8,"Arial Black",EMPTY_VALUE);

		ObjectCreate("Dot4",OBJ_LABEL,0,0,0);
		ObjectSet("Dot4",OBJPROP_XDISTANCE,62);
		ObjectSet("Dot4",OBJPROP_YDISTANCE,20);
		ObjectSetText("Dot4","M30",8,"Arial Black",EMPTY_VALUE);

		ObjectCreate("Dot5",OBJ_LABEL,0,0,0);
		ObjectSet("Dot5",OBJPROP_XDISTANCE,92);
		ObjectSet("Dot5",OBJPROP_YDISTANCE,20);
		ObjectSetText("Dot5","M15",8,"Arial Black",EMPTY_VALUE);

	}

int deinit()
	{
		ObjectDelete("Dot1");
		ObjectDelete("Dot2");
		ObjectDelete("Dot3");
		ObjectDelete("Dot4");
		ObjectDelete("Dot5");

	}

int start()

	{
	 bool D1=true;
    bool H4=true;
    bool H1=true;
    bool M30=true;
    bool M15=true;
		double RSIa, RSIb, CCIa,CCIb;
		int iIndicatorCounted=IndicatorCounted();
		if(iIndicatorCounted<0)
			{
				return(-1);
			}
		int iLimit=Bars-iIndicatorCounted;
		for(int i=iLimit;i>=0;i--)
			{
			if(M15)
					{
						dTemp[2,1]=iMA(NULL,PERIOD_M15,EMA2,0,MODE_EMA,PRICE_OPEN,i);
						dTemp[2,0]=iMA(NULL,PERIOD_M15,EMA,0,MODE_EMA,PRICE_CLOSE,i );
						RSIa = iRSI(NULL, 15, RSIv, PRICE_CLOSE, i );
						CCIa = iCCI(NULL, 15, CCIv, PRICE_CLOSE, i );
						if(dTemp[2,0]>dTemp[2,1] && RSIa > 50 && CCIa>50)
							{
								ObjectSet("Dot5",OBJPROP_COLOR,Lime);
							}
						else if(dTemp[2,0]<dTemp[2,1] && RSIa < 50&& CCIa<50)
							{
								ObjectSet("Dot5",OBJPROP_COLOR,Red);
							}
						else
							{
								ObjectSet("Dot5",OBJPROP_COLOR,DimGray);
							}
					}
			if(M30)
					{
						dTemp[3,1]=iMA(NULL,PERIOD_M30,EMA2,0,MODE_EMA,PRICE_OPEN,i);
						dTemp[3,0]=iMA(NULL,PERIOD_M30,EMA,0,MODE_EMA,PRICE_CLOSE,i );
						RSIa = iRSI(NULL, 30, RSIv, PRICE_CLOSE, i );
						CCIa = iCCI(NULL, 30, CCIv, PRICE_CLOSE, i );
						if(dTemp[3,0]>dTemp[3,1] && RSIa > 50 && CCIa>50)
							{
								ObjectSet("Dot4",OBJPROP_COLOR,Lime);
							}
						else if(dTemp[0,0]<dTemp[0,1] && RSIa < 50&& CCIa<50)
							{
								ObjectSet("Dot4",OBJPROP_COLOR,Red);
							}
						else
							{
								ObjectSet("Dot4",OBJPROP_COLOR,DimGray);
							}
					}
			if(H1)
					{
						dTemp[4,1]=iMA(NULL,PERIOD_H1,EMA2,0,MODE_EMA,PRICE_OPEN,i);
						dTemp[4,0]=iMA(NULL,PERIOD_H1,EMA,0,MODE_EMA,PRICE_CLOSE,i );
						RSIa = iRSI(NULL, 60, RSIv, PRICE_CLOSE, i );
						CCIa = iCCI(NULL, 60, CCIv, PRICE_CLOSE, i );
						if(dTemp[4,0]>dTemp[4,1] && RSIa > 50 && CCIa>50)
							{
								ObjectSet("Dot3",OBJPROP_COLOR,Lime);
							}
						else if(dTemp[4,0]<dTemp[4,1] && RSIa < 50&& CCIa<50)
							{
								ObjectSet("Dot3",OBJPROP_COLOR,Red);
							}
						else
							{
								ObjectSet("Dot3",OBJPROP_COLOR,DimGray);
							}
					}
				if(H4)
					{
						dTemp[0,1]=iMA(NULL,PERIOD_H4,EMA2,0,MODE_EMA,PRICE_OPEN,i);
						dTemp[0,0]=iMA(NULL,PERIOD_H4,EMA,0,MODE_EMA,PRICE_CLOSE,i );
						RSIa = iRSI(NULL, 240, RSIv, PRICE_CLOSE, i );
						CCIa = iCCI(NULL, 240, CCIv, PRICE_CLOSE, i );
						if(dTemp[0,0]>dTemp[0,1] && RSIa > 50 && CCIa>50)
							{
								ObjectSet("Dot2",OBJPROP_COLOR,Lime);
							}
						else if(dTemp[0,0]<dTemp[0,1] && RSIa < 50&& CCIa<50)
							{
								ObjectSet("Dot2",OBJPROP_COLOR,Red);
							}
						else
							{
								ObjectSet("Dot2",OBJPROP_COLOR,DimGray);
							}
					}
				if(D1)
					{
						dTemp[1,1]=iMA(NULL,PERIOD_D1,EMA2,0,MODE_EMA,PRICE_OPEN,i );
						dTemp[1,0]=iMA(NULL,PERIOD_D1,EMA,0,MODE_EMA,PRICE_CLOSE,i );
						RSIb = iRSI(NULL, 1440, RSIv, PRICE_CLOSE, i);
						CCIb = iCCI(NULL, 1440, CCIv, PRICE_CLOSE, i );

						if(dTemp[1,0]>dTemp[1,1] && RSIb > 50&& CCIb>50)
							{
								ObjectSet("Dot1",OBJPROP_COLOR,Lime);
							}
						else if(dTemp[1,0]<dTemp[1,1] && RSIb < 50&& CCIb<50)
							{
								ObjectSet("Dot1",OBJPROP_COLOR,Red);
							}
						else
							{
								ObjectSet("Dot1",OBJPROP_COLOR,DimGray);
							}
					}

			}
	}
Comments