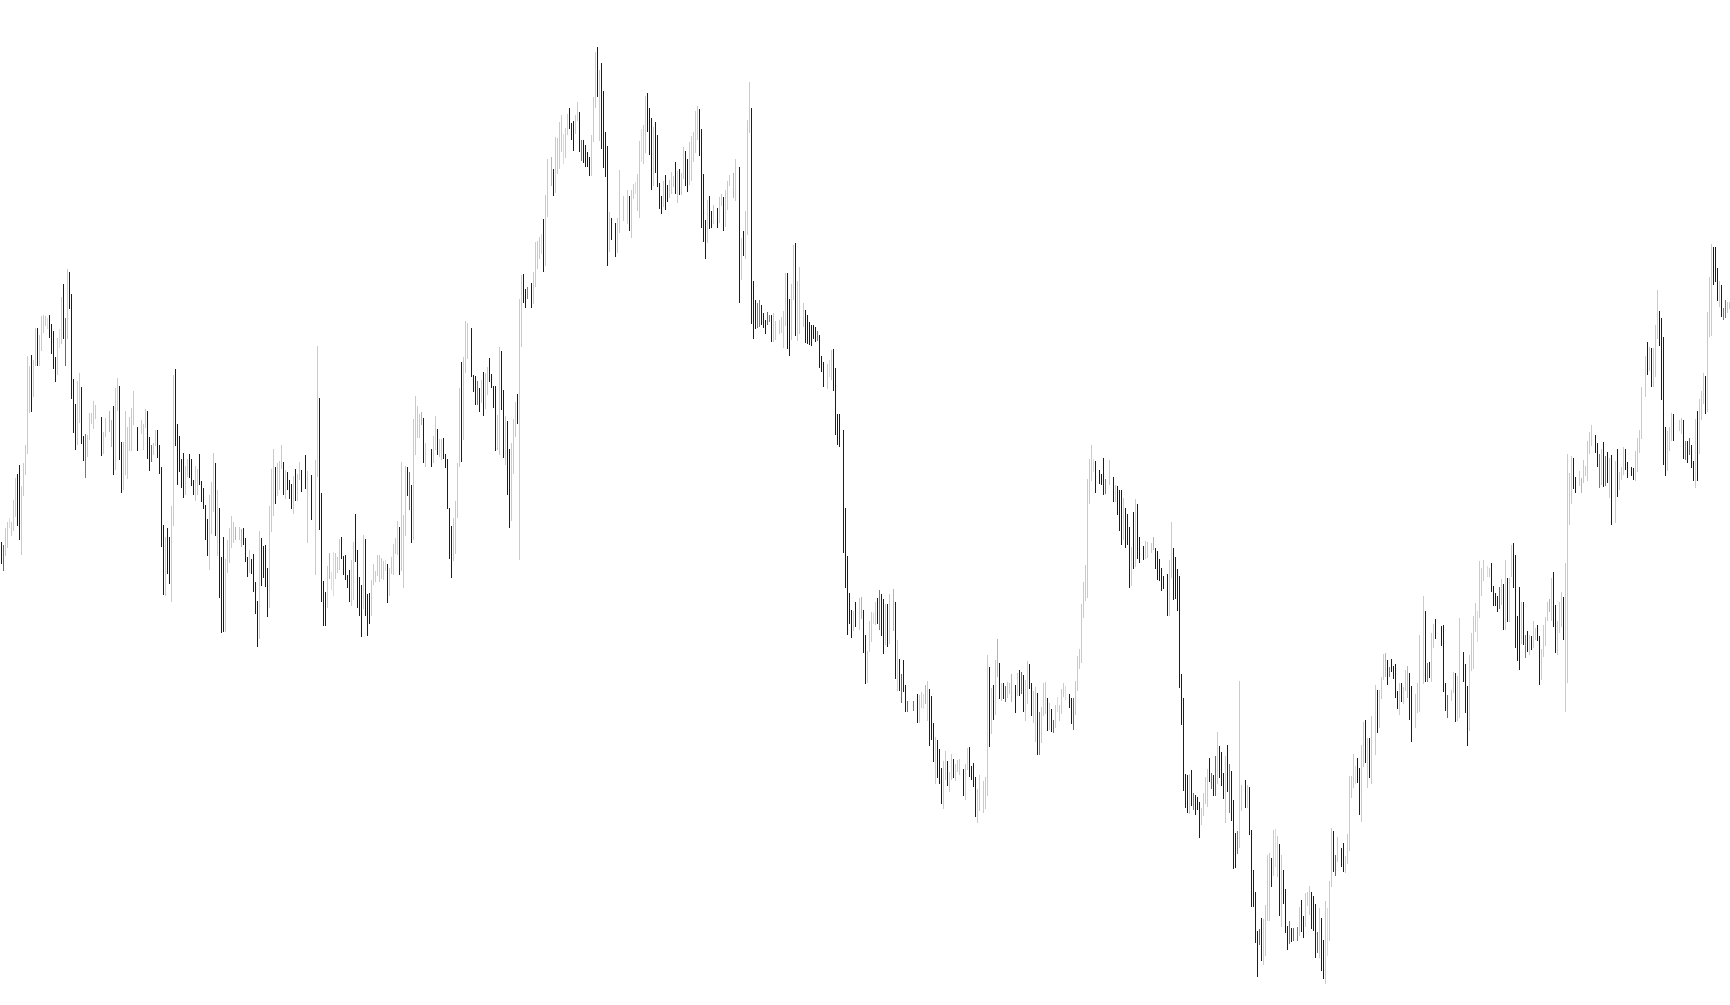
This script is designed as a visual market analysis tool for the MetaTrader platform. Its primary function is to identify and highlight specific price movements based on historical trends and predefined distance thresholds. Instead of providing standard trend lines, it uses a series of logic checks to detect "reversals" or "corrections" within the price action.
Core Operational Logic
1. Trend Direction Detection The script constantly monitors the relationship between the high and low prices of historical bars. It determines the dominant direction of the market by comparing previous price points. If the current data suggests an upward movement, it labels the environment accordingly; if downward, it marks it as such. This creates a foundational "memory" of which way the price has been moving.
2. Dynamic Threshold Filtering A key feature of this script is its use of "Points"—a user-defined sensitivity setting. The logic calculates four distinct intensity levels (based on 25%, 50%, 75%, and 100% of your chosen point value). This allows the script to distinguish between minor fluctuations and significant market shifts.
3. Multilayered Signal Mapping The script processes the data through several "layers" of logic simultaneously. For every price candle, it asks a series of questions:
- Has the price moved enough in the opposite direction to qualify as a significant reversal?
- Has the price reached a specific percentage of the defined movement limit?
- Is the current price action maintaining the established trend or breaking away from it?
4. Visual Output Based on these calculations, the script populates eight different visual buffers on your chart. Each buffer represents a different level of market sensitivity:
- Some layers capture major structural shifts (large movements).
- Other layers capture finer, more aggressive price corrections (smaller movements).
When a specific movement threshold is met—for example, a price drop that exceeds a certain percentage of the "Points" value while in an uptrend—the script clears out irrelevant data and highlights the new price extremes.
Summary for the User
Think of this tool as a sophisticated "event tracker." It looks back at historical price bars to see how far the market has traveled. When it detects that the price has moved significantly enough to meet one of its pre-set criteria (the various fractions of your "Points" input), it places a visual marker on the chart. This helps traders identify specific points where momentum might be shifting or where significant price milestones have been reached.
//+------------------------------------------------------------------+
//|                                                      Movment.mq4 |
//|                                                                * |
//|                                                                * |
//+------------------------------------------------------------------+
#property copyright "Integer"
#property link      "for-good-letters@yandex.ru"
//----
#property indicator_chart_window
#property indicator_buffers 8
#property indicator_color1 Red
#property indicator_color2 Blue
#property indicator_color3 LightCoral
#property indicator_color4 CornflowerBlue
#property indicator_color5 LightPink
#property indicator_color6 LightBlue
#property indicator_color7 MistyRose
#property indicator_color8 LightCyan
#property indicator_width1 3
#property indicator_width2 3
#property indicator_width3 3
#property indicator_width4 3
#property indicator_width5 3
#property indicator_width6 3
#property indicator_width7 3
#property indicator_width8 3
//---- input parameters
extern int  Points = 24;
//---- buffers
double ExtMapBuffer1[];
double ExtMapBuffer2[];
double ExtMapBuffer3[];
double ExtMapBuffer4[];
double ExtMapBuffer5[];
double ExtMapBuffer6[];
double ExtMapBuffer7[];
double ExtMapBuffer8[];
//+------------------------------------------------------------------+
//| Custom indicator initialization function                         |
//+------------------------------------------------------------------+
int init()
  {
//---- indicators
   SetIndexStyle(0, DRAW_HISTOGRAM);
   SetIndexBuffer(0, ExtMapBuffer1);
   SetIndexStyle(1, DRAW_HISTOGRAM);
   SetIndexBuffer(1, ExtMapBuffer2);
   SetIndexStyle(2, DRAW_HISTOGRAM);
   SetIndexBuffer(2, ExtMapBuffer3);
   SetIndexStyle(3, DRAW_HISTOGRAM);
   SetIndexBuffer(3, ExtMapBuffer4);
   SetIndexStyle(4, DRAW_HISTOGRAM);
   SetIndexBuffer(4, ExtMapBuffer5);
   SetIndexStyle(5, DRAW_HISTOGRAM);
   SetIndexBuffer(5, ExtMapBuffer6);
   SetIndexStyle(6, DRAW_HISTOGRAM);
   SetIndexBuffer(6, ExtMapBuffer7);
   SetIndexStyle(7, DRAW_HISTOGRAM);
   SetIndexBuffer(7, ExtMapBuffer8);
//----
   return(0);
  }
//+------------------------------------------------------------------+
//| Custom indicator deinitialization function                       |
//+------------------------------------------------------------------+
int deinit()
  {
//----
   return(0);
  }
//+------------------------------------------------------------------+
//| Custom indicator iteration function                              |
//+------------------------------------------------------------------+
int start()
  {
   int limit = Bars - IndicatorCounted() - 1;
   static int tr = 1;
   for(int i = limit; i >= 0; i--)
     {
       for(int j = i + 1; j < Bars; j++)
         {
           if(ExtMapBuffer1[j] > ExtMapBuffer2[j])
             {
               ExtMapBuffer1[i]=High[i];
               ExtMapBuffer2[i]=Low[i];
               break;
             }
           if(ExtMapBuffer1[j] < ExtMapBuffer2[j])
             {
               ExtMapBuffer1[i]=Low[i];
               ExtMapBuffer2[i]=High[i];
               break;
             }
         }
       if(ExtMapBuffer1[i] > ExtMapBuffer2[i] || tr == 1)
         {
           //red now
           for(j = i; j < Bars; j++)
             {
               if(ExtMapBuffer1[j] < ExtMapBuffer2[j])
                   break;
               if(Close[i] - Close[j] <= -Point*Points*(4.0 / 4))
                 {
                   ExtMapBuffer3[i] = EMPTY_VALUE;
                   ExtMapBuffer4[i] = EMPTY_VALUE;
                   ExtMapBuffer5[i] = EMPTY_VALUE;
                   ExtMapBuffer6[i] = EMPTY_VALUE;
                   ExtMapBuffer7[i] = EMPTY_VALUE;
                   ExtMapBuffer8[i] = EMPTY_VALUE;
                   ExtMapBuffer1[i] = Low[i];
                   ExtMapBuffer2[i] = High[i];
                   tr = 0;
                   break;
                 }
             }
         }
       if(ExtMapBuffer1[i] < ExtMapBuffer2[i] || tr == 1)
         {
           //red now
           for(j = i; j < Bars; j++)
             {
               if(ExtMapBuffer1[j] > ExtMapBuffer2[j])
                   break;
               if(Close[i] - Close[j] >= Point*Points*(4.0 / 4))
                 {
                   ExtMapBuffer3[i] = EMPTY_VALUE;
                   ExtMapBuffer4[i] = EMPTY_VALUE;
                   ExtMapBuffer5[i] = EMPTY_VALUE;
                   ExtMapBuffer6[i] = EMPTY_VALUE;
                   ExtMapBuffer7[i] = EMPTY_VALUE;
                   ExtMapBuffer8[i] = EMPTY_VALUE;
                   ExtMapBuffer1[i] = High[i];
                   ExtMapBuffer2[i] = Low[i];
                   tr = 0;
                   break;
                 }
             }
         }
       if(ExtMapBuffer1[i] > ExtMapBuffer2[i])
         {
           //red now
           for(j = i; j < Bars; j++)
             {
               if(ExtMapBuffer1[j] < ExtMapBuffer2[j])
                   break;
               if(Close[i] - Close[j] <= -Point*Points*(1.0 / 4))
                 {
                   ExtMapBuffer5[i] = EMPTY_VALUE;
                   ExtMapBuffer6[i] = EMPTY_VALUE;
                   ExtMapBuffer7[i] = EMPTY_VALUE;
                   ExtMapBuffer8[i] = EMPTY_VALUE;
                   ExtMapBuffer3[i] = High[i];
                   ExtMapBuffer4[i] = Low[i];
                   break;
                 }
             }
         }
       if(ExtMapBuffer1[i] < ExtMapBuffer2[i])
         {
           //red now
           for(j = i; j < Bars; j++)
             {
               if(ExtMapBuffer1[j] > ExtMapBuffer2[j])
                   break;
               if(Close[i] - Close[j] >= Point*Points*(1.0 / 4))
                 {
                   ExtMapBuffer5[i] = EMPTY_VALUE;
                   ExtMapBuffer6[i] = EMPTY_VALUE;
                   ExtMapBuffer7[i] = EMPTY_VALUE;
                   ExtMapBuffer8[i] = EMPTY_VALUE;
                   ExtMapBuffer3[i] = Low[i];
                   ExtMapBuffer4[i] = High[i];
                   break;
                 }
             }
         }
       if(ExtMapBuffer1[i]>ExtMapBuffer2[i])
         {
           //red now
           for(j = i; j < Bars; j++)
             {
               if(ExtMapBuffer1[j] < ExtMapBuffer2[j])
                   break;
               if(Close[i] - Close[j] <= -Point*Points*(2.0 / 4))
                 {
                   ExtMapBuffer3[i] = EMPTY_VALUE;
                   ExtMapBuffer4[i] = EMPTY_VALUE;
                   ExtMapBuffer7[i] = EMPTY_VALUE;
                   ExtMapBuffer8[i] = EMPTY_VALUE;
                   ExtMapBuffer5[i] = High[i];
                   ExtMapBuffer6[i] = Low[i];
                   break;
                 }
             }
         }
       if(ExtMapBuffer1[i] < ExtMapBuffer2[i])
         {
           //red now
           for(j = i; j < Bars; j++)
             {
               if(ExtMapBuffer1[j] > ExtMapBuffer2[j])
                   break;
               if(Close[i] - Close[j] >= Point*Points*(2.0 / 4))
                 {
                   ExtMapBuffer3[i] = EMPTY_VALUE;
                   ExtMapBuffer4[i] = EMPTY_VALUE;
                   ExtMapBuffer7[i] = EMPTY_VALUE;
                   ExtMapBuffer8[i] = EMPTY_VALUE;
                   ExtMapBuffer5[i] = Low[i];
                   ExtMapBuffer6[i] = High[i];
                   break;
                 }
             }
         }
       if(ExtMapBuffer1[i] > ExtMapBuffer2[i])
         {
           //red now
           for(j = i; j < Bars; j++)
             {
               if(ExtMapBuffer1[j] < ExtMapBuffer2[j])
                   break;
               if(Close[i] - Close[j] <= -Point*Points*(3.0 / 4))
                 {
                   ExtMapBuffer3[i] = EMPTY_VALUE;
                   ExtMapBuffer4[i] = EMPTY_VALUE;
                   ExtMapBuffer5[i] = EMPTY_VALUE;
                   ExtMapBuffer6[i] = EMPTY_VALUE;
                   ExtMapBuffer7[i] = High[i];
                   ExtMapBuffer8[i] = Low[i];
                   break;
                 }
             }
         }
       if(ExtMapBuffer1[i] < ExtMapBuffer2[i])
         {
           //red now
           for(j = i; j < Bars; j++)
             {
               if(ExtMapBuffer1[j] > ExtMapBuffer2[j])
                   break;
               if(Close[i] - Close[j] >= Point*Points*(3.0 / 4))
                 {
                   ExtMapBuffer3[i] = EMPTY_VALUE;
                   ExtMapBuffer4[i] = EMPTY_VALUE;
                   ExtMapBuffer5[i] = EMPTY_VALUE;
                   ExtMapBuffer6[i] = EMPTY_VALUE;
                   ExtMapBuffer7[i] = Low[i];
                   ExtMapBuffer8[i] = High[i];
                   break;
                 }
             }
         } /*
       if(ExtMapBuffer1[i] > ExtMapBuffer2[i])
         {
           //red now
           for(j = i; j < Bars; j++)
             {
               if(ExtMapBuffer1[i] > ExtMapBuffer2[i])
                   break;
               if(Close[i] - Close[j] <= -Point*Points*(2.0 / 4))
                 {
                   ExtMapBuffer5[i] = High[i];
                   ExtMapBuffer6[i] = Low[i];
                   break;
                 }
             }
         }
       if(ExtMapBuffer1[i] < ExtMapBuffer2[i])
         {
           //red now
           for(j = i; j < Bars; j++)
             {
               if(ExtMapBuffer1[j] > ExtMapBuffer2[j])
                   break;
               if(Close[i] - Close[j] >= Point*Points*(2.0 / 4))
                 {
                   ExtMapBuffer5[i] = Low[i];
                   ExtMapBuffer6[i] = High[i];
                   break;
                 }
             }
         }
       if(ExtMapBuffer1[i] > ExtMapBuffer2[i])
         {
           //red now
           for(j = i; j < Bars; j++)
             {
               if(ExtMapBuffer1[j] < ExtMapBuffer2[j])
                   break;
               if(Close[i] - Close[j] <= -Point*Points*(3.0 / 4))
                 {
                   ExtMapBuffer7[i] = High[i];
                   ExtMapBuffer8[i] = Low[i];
                   break;
                 }
             }
         }
       if(ExtMapBuffer1[i] < ExtMapBuffer2[i])
         {
           //red now
           for(j = i; j < Bars; j++)
             {
               if(ExtMapBuffer1[j] > ExtMapBuffer2[j])
                   break;
               if(Close[i] - Close[j] >= Point*Points*(3.0 / 4))
                 {
                   ExtMapBuffer7[i] = Low[i];
                   ExtMapBuffer8[i] = High[i];
                   break;
                 }
             }
         } */
     }
//----
   return(0);
  }
//+------------------------------------------------------------------+
Comments