MTF Relative Strength Index
Download script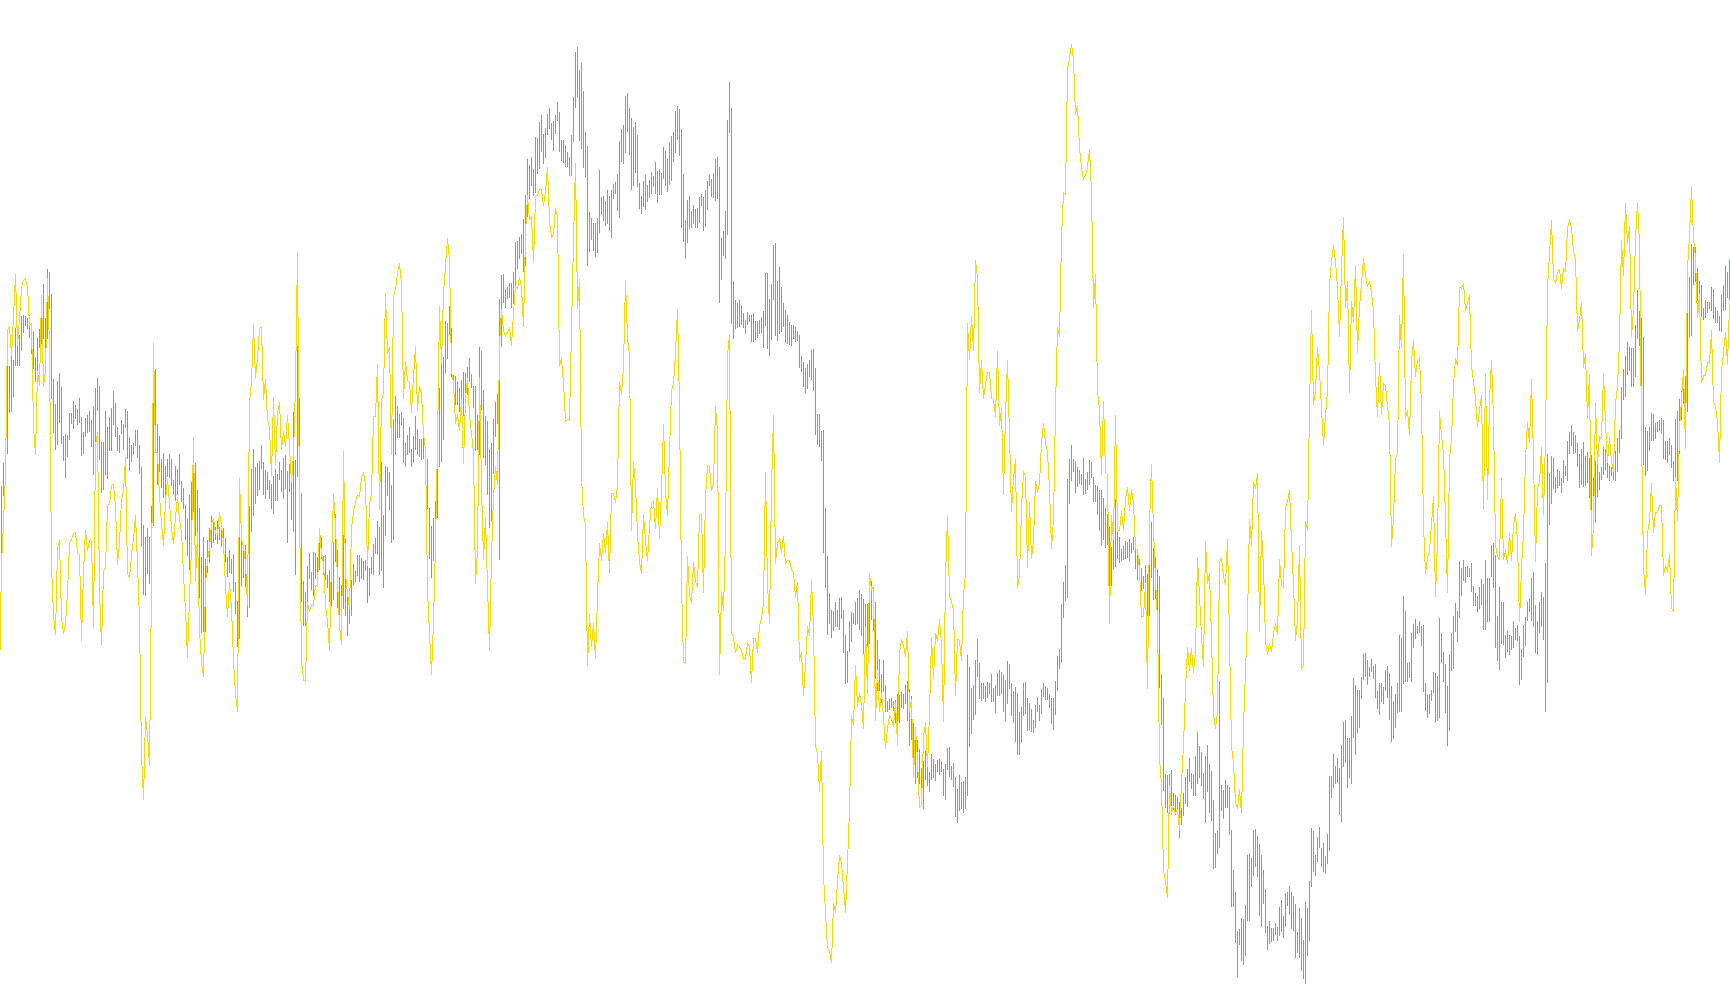
This tool is designed to help traders analyze market momentum by displaying the Relative Strength Index (RSI) from a different time frame than the one they are currently viewing on their screen. It essentially allows you to keep an eye on the "big picture" without having to constantly switch between different charts.
How it Works
Multi-Time Frame Synchronization The core logic of this script is its ability to bridge two different periods of time. For example, if you are looking at a very detailed 5-minute chart but want to know what the trend looks like on an hourly basis, this tool calculates and draws that hourly data directly onto your 5-minute screen. It automatically aligns the data points so that the history remains consistent regardless of which timeframe you choose to prioritize.
Customizable Calculations The script offers several layers of personalization to ensure the data fits your specific trading style:
- Time Frame Selection: You can choose from a wide range of intervals, from 1-minute and 5-minute scales up to daily, weekly, and monthly views.
- Price Source Variety: Rather than just looking at the closing price of a candle, you can tell the script to calculate the momentum based on different price points, such as the opening price, the highest/lowest reached, or even weighted averages.
- Sensitivity Adjustments: You can modify the lookback period (the "RSIPeriod") to determine how sensitive the indicator is to recent price movements—making it faster to react to news or slower to filter out market noise.
Visual Output
The tool plots a smooth line in a separate window at the bottom of your trading platform. It uses standard industry levels (30 and 70) to help you identify potential "overbought" or "oversold" conditions. By using this, you can identify when a major trend is reaching an exhaustion point on a higher timeframe while you are still executing trades on a smaller, more precise timeframe.
//+------------------------------------------------------------------+
//|                                  MTF Relative Strength Index.mq4 |
//+------------------------------------------------------------------+
#property copyright "mqlservice.co.uk"
#property link      "http://mqlservice.co.uk/"

#property indicator_separate_window
#property indicator_buffers 1
#property indicator_color1 DodgerBlue
#property indicator_level1 30
#property indicator_level2 70
#property indicator_minimum 0
#property indicator_maximum 100
//---- input parameters
extern int    TimeFrame=0;
extern int    RSIPeriod=14;
extern int    AppliedPrice=0;
extern int    Shift=0;
extern string     note0="Applied price 0-CLOSE | 1-OPEN | 2-HIGH | 3-LOW |";
extern string     note1="            | 4-MEDIAN | 5-TYPICAL | 6-WEIGHTED |";
extern string     note2 = "Time Frame 0=current time frame";
extern string     note3 = "1=M1, 5=M5, 15=M15, 30=M30";
extern string     note4 = "60=H1, 240=H4, 1440=D1";
extern string     note5 = "10080=W1, 43200=MN1";
//---- buffers
double MainBuffer[];

//+------------------------------------------------------------------+
//| Custom indicator initialization function                         |
//+------------------------------------------------------------------+
int init()
{
   int    draw_begin=RSIPeriod;
   string short_name="MTF RSI ";

   //---- indicators
   SetIndexStyle(0,DRAW_LINE);
   SetIndexBuffer(0,MainBuffer);
   Print("MTF Relative Strength Index , Ver.#2");
   Print("Copyright © 2009/05/26  MQL Service UK   http://mqlservice.co.uk/");
   switch(AppliedPrice){
      case 1 : short_name=short_name+"| OPEN "; break;
      case 2 : short_name=short_name+"| HIGH "; break;
      case 3 : short_name=short_name+"| LOW "; break;
      case 4 : short_name=short_name+"| MEDIAN "; break;
      case 5 : short_name=short_name+"| TYPICAL "; break;
      case 6 : short_name=short_name+"| WEIGHTED "; break;
      default :
         AppliedPrice=PRICE_CLOSE; short_name=short_name+"| CLOSE "; break;
   }
   if(TimeFrame<Period()) TimeFrame=Period();
   string TFName="";
   switch(TimeFrame)
   {
      case 1 : TFName="M1"; break;
      case 5 : TFName="M5"; break;
      case 15 : TFName="M15"; break;
      case 30 : TFName="M30"; break;
      case 60 : TFName="H1"; break;
      case 240 : TFName="H4"; break;
      case 1440 : TFName="D1"; break;
      case 10080 : TFName="W1"; break;
      case 43200 : TFName="MN1"; break;
      default : TFName="Chart"; TimeFrame=Period(); break;
   }
   short_name=StringConcatenate(short_name," (TF "+TFName+","+RSIPeriod+")");
   IndicatorShortName(short_name);
   SetIndexDrawBegin(0,draw_begin);
   SetIndexLabel(0,"Main");
   IndicatorDigits(4);
   return(0);
}
//+------------------------------------------------------------------+
//| Custom indicator deinitialization function                       |
//+------------------------------------------------------------------+
int deinit()
{
   //----

   //----
   return(0);
}
//+------------------------------------------------------------------+
//| Custom indicator iteration function                              |
//+------------------------------------------------------------------+
int start()
{
  int limit, iChart, iTF, delta=0;
  datetime TimeArray[];
  if(TimeFrame>Period()) delta=MathCeil(TimeFrame/Period());
  int counted_bars=IndicatorCounted();
  //---- check for possible errors
  if(counted_bars<0) return(-1);
  //---- the last counted bar will be recounted
  if(counted_bars>0) counted_bars--;
  limit=Bars-counted_bars+delta;

  ArrayCopySeries(TimeArray,MODE_TIME,Symbol(),TimeFrame);

  iTF=0;
  for(iChart=0; iChart<limit; iChart++)
  {
      while(Time[iChart]<TimeArray[iTF]) iTF++;
      MainBuffer[iChart]=EMPTY_VALUE;
      MainBuffer[iChart]=iRSI(Symbol(),TimeFrame,RSIPeriod,AppliedPrice,iTF+Shift);
  }
  return(0);
}

//+-------------------------------------------------------------------+
Comments