MVBT3
Download script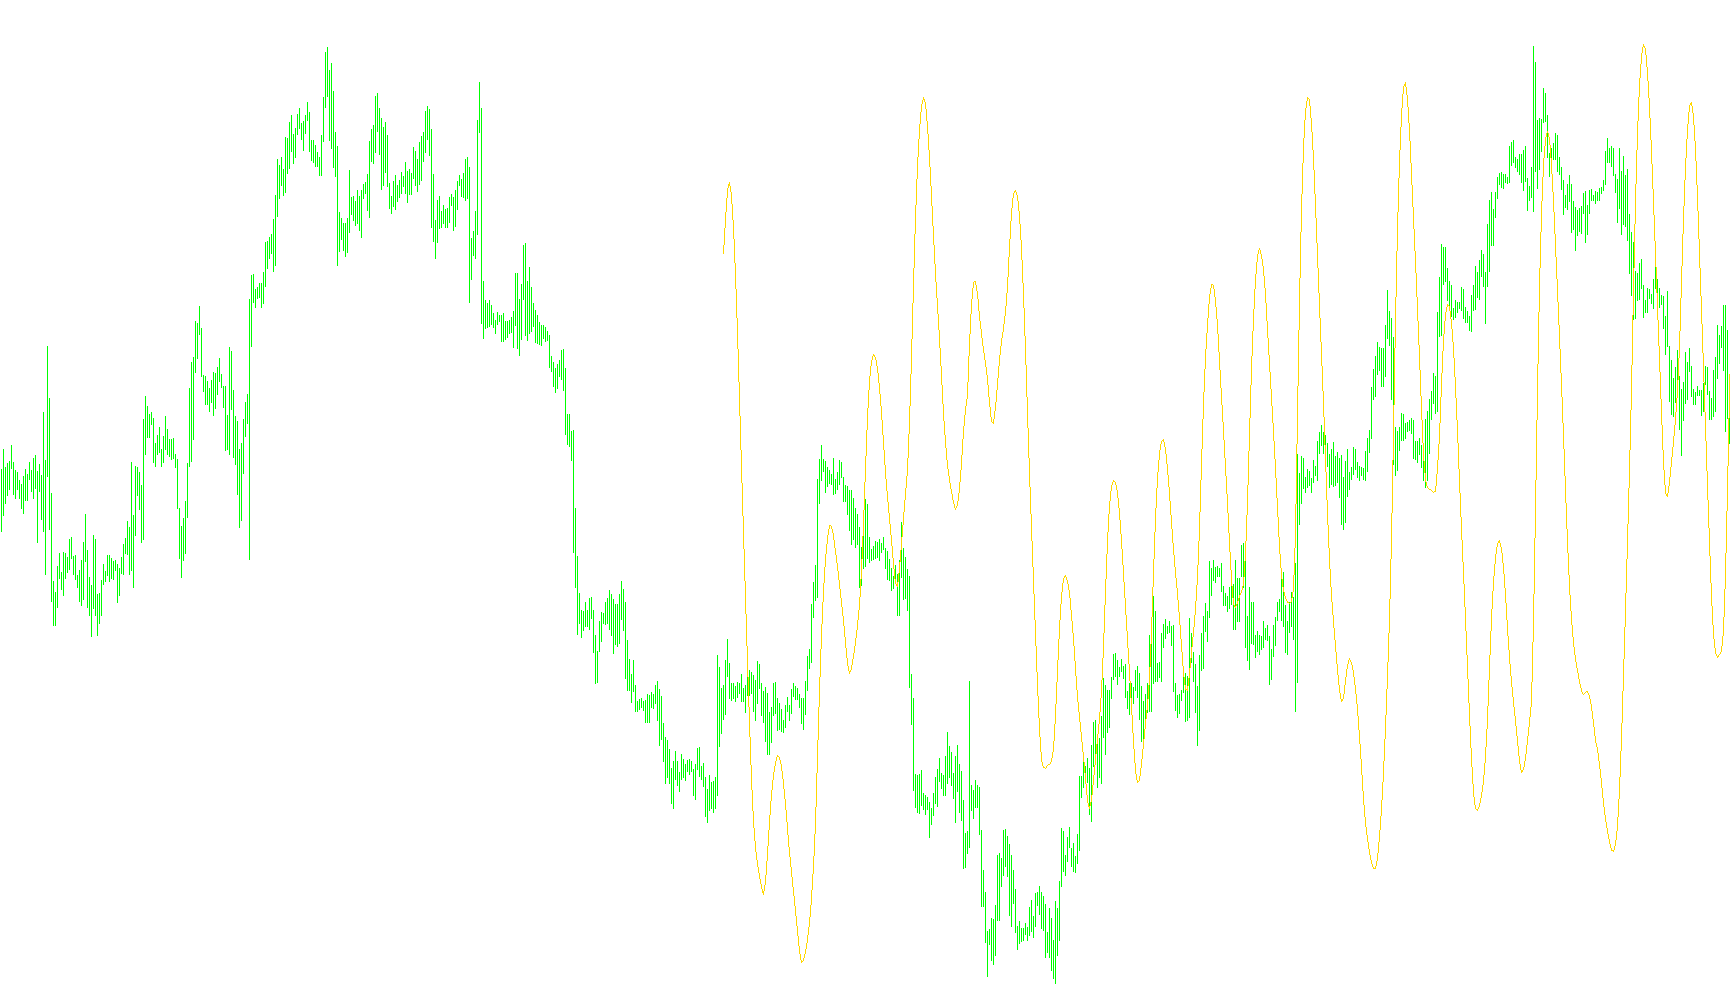
This tool is designed to provide traders with a smoothed visual representation of market activity, specifically focusing on volume dynamics over a specific timeframe. Rather than simply looking at raw price movements, this indicator analyzes the "flow" of trading activity to help identify underlying trends in market participation.
Core Logic and Functionality
Data Smoothing and Filtering The primary objective of this script is to eliminate the "noise" typically found in raw volume data. Market volume can be erratic, with sudden spikes that might distract from the broader trend. This tool applies a multi-layered smoothing process (a series of recursive calculations) to filter out these inconsistencies, creating a more fluid and readable line on your chart.
Weighting and Sensitivity The indicator uses a specialized mathematical framework to determine how much importance to give to recent data versus older data:
- Periodicity: You can define the look-back period, which dictates how much historical information the tool considers at once.
- Sensitivity Factor: The logic utilizes a specific coefficient (defaulting to 0.72) that balances the speed of the indicator. This ensures that the line reacts quickly enough to be useful while remaining smooth enough to avoid false signals.
The Calculation Process Behind the scenes, the tool performs a sequence of weighted calculations:
- It looks at the difference in volume between consecutive bars.
- It passes this data through six different "smoothing stages," where each stage refines the result of the previous one.
- Finally, it combines these refined values using specific mathematical constants to produce a single, coherent output line.
How It Appears on Your Chart
The indicator appears in a separate window below your main price chart. It generates a solid line (colored FireBrick by default) that tracks the processed volume trends.
By observing the direction and momentum of this line, traders can get a clearer sense of whether market activity is accelerating or decelerating. Because it focuses on smoothed volume rather than raw price, it serves as a secondary confirmation tool to help gauge the strength behind current market moves.
/*-----------------------------+
|			       |
| Shared by www.Aptrafx.com    |
|			       |
+------------------------------*/

//+------------------------------------------------------------------+
//|                                                        MVBT3.mq4 |
//|                      Copyright © 2006, MetaQuotes Software Corp. |
//|                                        http://www.metaquotes.net |
//+------------------------------------------------------------------+
#property copyright "Copyright © 2006, MetaQuotes Software Corp."
#property link      "http://www.metaquotes.net"

#property indicator_separate_window

#property indicator_buffers 1

#property indicator_color1 FireBrick

#property indicator_level1  0.0000

extern int T3_Period = 69; // I recommend 72% of the number of bars per day , M15 Chart = 96 bars per day .
extern double b = 0.72;
extern int ShowDays = 21;

double MapBuffer[];

double e1,e2,e3,e4,e5,e6;
double c1,c2,c3,c4;
double n,w1,w2,b2,b3;

//+------------------------------------------------------------------+
//| Custom indicator initialization function                         |
//+------------------------------------------------------------------+
int init()
  {
//---- indicators setting
    SetIndexStyle(0,DRAW_LINE,STYLE_SOLID);
    IndicatorDigits(MarketInfo(Symbol(),MODE_DIGITS));
    IndicatorShortName(" MVBT3 ( "+T3_Period+" ) , ( "+b+" ) ");

    SetIndexBuffer(0,MapBuffer);

//---- variable reset

    e1=0; e2=0; e3=0; e4=0; e5=0; e6=0;
    c1=0; c2=0; c3=0; c4=0;
    n=0;
    w1=0; w2=0;
    b2=0; b3=0;

    b2=b*b;
    b3=b2*b;
    c1=-b3;
    c2=(3*(b2+b3));
    c3=-3*(2*b2+b+b3);
    c4=(1+3*b+b3+3*b2);
    n=T3_Period;

    if (n<1) n=1;
    n = 1 + (0.5*(n-1));
    w1 = 2 / (n + 1);
    w2 = 1 - w1;

//----
    return(0);
  }

//+------------------------------------------------------------------+
//| Custom indicator iteration function                              |
//+------------------------------------------------------------------+
int start()
  {
   int limit = ((ShowDays*1440)/Period());

//---- indicator calculation

    for(int i=limit; i>=0; i--)
    {

        double smooth1 = Volume[i];

        double smooth2 = Volume[i+1];

        e1 = ( (w1*(smooth1 - smooth2)) + w2*e1 );
        e2 = ((w1*e1) + w2*e2);
        e3 = ((w1*e2) + w2*e3);
        e4 = ((w1*e3) + w2*e4);
        e5 = ((w1*e4) + w2*e5);
        e6 = ((w1*e5) + w2*e6);

        MapBuffer[i]=((((c1*e6) + c2*e5) + c3*e4) + c4*e3);

    }
//----
   return(0);
  }
//+------------------------------------------------------------------+
Comments