newMACD_Alert
Download script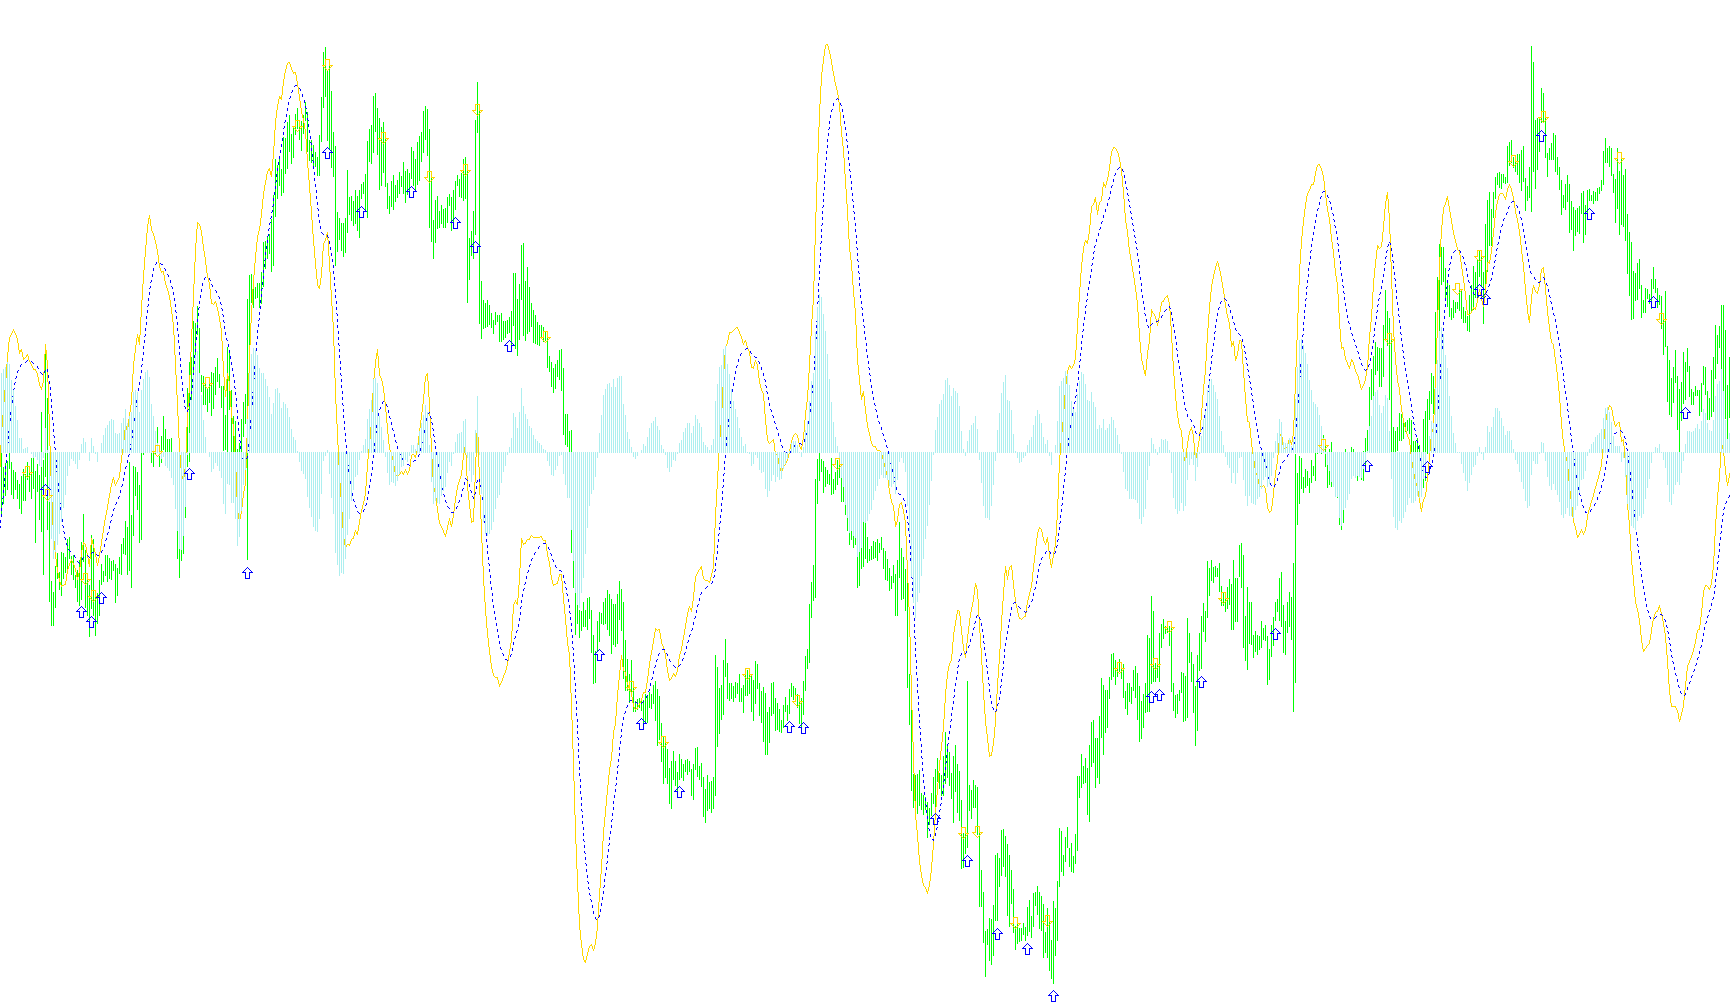
This tool is designed to analyze financial market trends by calculating and visualizing the Moving Average Convergence Divergence (MACD), a popular momentum indicator. It helps traders identify shifts in price momentum by comparing short-term price movements against long-term averages.
Core Functionality
The script performs three primary calculations to provide a comprehensive view of the market:
- The MACD Line: The tool calculates two different types of moving averages—one "Fast" and one "Slow." By subtracting the value of the Slow average from the Fast average, it produces the MACD Line. This represents the immediate strength of the current trend.
- The Signal Line: This is a secondary moving average applied specifically to the MACD Line itself. It acts as a "smoothing" agent, making it easier to identify the underlying direction of the momentum without getting distracted by minor price fluctuations.
- The Histogram: This visual representation shows the mathematical difference between the MACD Line and the Signal Line. When the histogram bars grow taller or shorter, they indicate how much the current momentum is pulling away from its average trend.
Visual Logic and Alerts
Beyond simply plotting lines and bars on your chart, the script includes an automated visual signaling system:
- Trend Reversal Detection: The logic constantly monitors the "Histogram" values for specific shifts in polarity (moving from positive to negative or vice versa).
- Automated Visual Markers: When a significant shift in momentum is detected, the script automatically places arrow markers on your chart:
- A Blue Arrow appears when the histogram flips from positive to negative, potentially signaling a downward shift in momentum.
- A Gold Arrow appears when the histogram flips from negative to positive, potentially signaling an upward shift in momentum.
Summary for the User
In simple terms, this script does the heavy lifting of calculating complex averages for you. It translates raw price data into a visual "momentum map." Instead of you having to manually watch every fluctuation, the script highlights specific turning points where the trend's strength begins to reverse, marking those moments with clear visual indicators on your trading screen.
//+------------------------------------------------------------------+
//|                                                newMACD_Alert.mq4 |
//|                                Copyright © 2005, David W. Thomas |
//|                                           mailto:davidwt@usa.net |
//+------------------------------------------------------------------+
// This is the correct computation and display of MACD.
#property copyright "Copyright © 2005, David W. Thomas"
#property link      "mailto:davidwt@usa.net"

#property indicator_separate_window
#property indicator_buffers 3
#property indicator_color1 Blue
#property indicator_color2 Red
#property indicator_color3 Green

//---- input parameters
extern int FastMAPeriod = 12;
extern int SlowMAPeriod = 26;
extern int SignalMAPeriod = 9;


//---- buffers
double MACDLineBuffer[];
double SignalLineBuffer[];
double HistogramBuffer[];
//---- variables
double alpha = 0;
double alpha_1 = 0;


void SetArrow(datetime ArrowTime, double Price, double ArrowCode, color ArrowColor)
{
 int err;
 string ArrowName = DoubleToStr(ArrowTime,0);
   if (ObjectFind(ArrowName) != -1) ObjectDelete(ArrowName);
   if(!ObjectCreate(ArrowName, OBJ_ARROW, 0, ArrowTime, Price))
    {
      err=GetLastError();
      Print("error: can't create Arrow! code #",err);
      return;
    }
   else
   {
     ObjectSet(ArrowName, OBJPROP_ARROWCODE, ArrowCode);
     ObjectSet(ArrowName, OBJPROP_COLOR , ArrowColor);
     ObjectsRedraw();
     /*if(ArrowCode==241)Alert("NMACD ",Period()," ",Symbol()," BUY");
     if(ArrowCode==242)Alert("NMACD ",Period()," ",Symbol()," SELL");
     PlaySound("alert2.wav");*/
   }
}

//+------------------------------------------------------------------+
//| Custom indicator initialization function                         |
//+------------------------------------------------------------------+
int init()
{
   IndicatorDigits(Digits + 1);
   //---- indicators
   SetIndexStyle(0, DRAW_LINE);
   SetIndexBuffer(0, MACDLineBuffer);
   SetIndexDrawBegin(0, SlowMAPeriod);
   SetIndexStyle(1, DRAW_LINE, STYLE_DOT);
   SetIndexBuffer(1, SignalLineBuffer);
   SetIndexDrawBegin(1, SlowMAPeriod + SignalMAPeriod);
   SetIndexStyle(2, DRAW_HISTOGRAM);
   SetIndexBuffer(2, HistogramBuffer);
   SetIndexDrawBegin(2, SlowMAPeriod + SignalMAPeriod);
   //---- name for DataWindow and indicator subwindow label
   IndicatorShortName("NMACD_Alert(" + FastMAPeriod+"," + SlowMAPeriod + "," + SignalMAPeriod + ")");
   SetIndexLabel(0, "NMACD");
   SetIndexLabel(1, "Signal");
   SetIndexLabel(2, "Histogr");
   //----
	  alpha = 2.0 / (SignalMAPeriod + 1.0);
	  alpha_1 = 1.0 - alpha;
   //----
   return(0);
}
//+------------------------------------------------------------------+
//| Custor indicator deinitialization function                       |
//+------------------------------------------------------------------+
int deinit()
  {
   //----
   ObjectsDeleteAll(0);
   return(0);
  }
//+------------------------------------------------------------------+
//| Custom indicator iteration function                              |
//+------------------------------------------------------------------+
int start()
  {
   int limit;
   int counted_bars = IndicatorCounted();
   //---- check for possible errors
   if(counted_bars < 0)
       return(-1);
   //---- last counted bar will be recounted
   if(counted_bars > 0)
       counted_bars--;
   limit = Bars - counted_bars;
//----
   for(int i = limit; i >= 0; i--)
     {
       MACDLineBuffer[i] = iMA(NULL, 0, FastMAPeriod, 0, MODE_EMA, PRICE_CLOSE, i) -
                           iMA(NULL, 0, SlowMAPeriod, 0, MODE_EMA, PRICE_CLOSE, i);
       SignalLineBuffer[i] = alpha*MACDLineBuffer[i] + alpha_1*SignalLineBuffer[i+1];
       HistogramBuffer[i] = MACDLineBuffer[i] - SignalLineBuffer[i];
       if((HistogramBuffer[i+1]>0)&&(HistogramBuffer[i+2]<=0))
       {
          SetArrow(Time[i+1],Low[i+1]-15*Point,241,Blue);
       }
       if((HistogramBuffer[i+1]<0)&&(HistogramBuffer[i+2]>=0))
       {
          SetArrow(Time[i+1],High[i+1]+15*Point,242,Gold);
       }
    }
//----
   return(0);
  }
//+------------------------------------------------------------------+
Comments