NoName02
Download script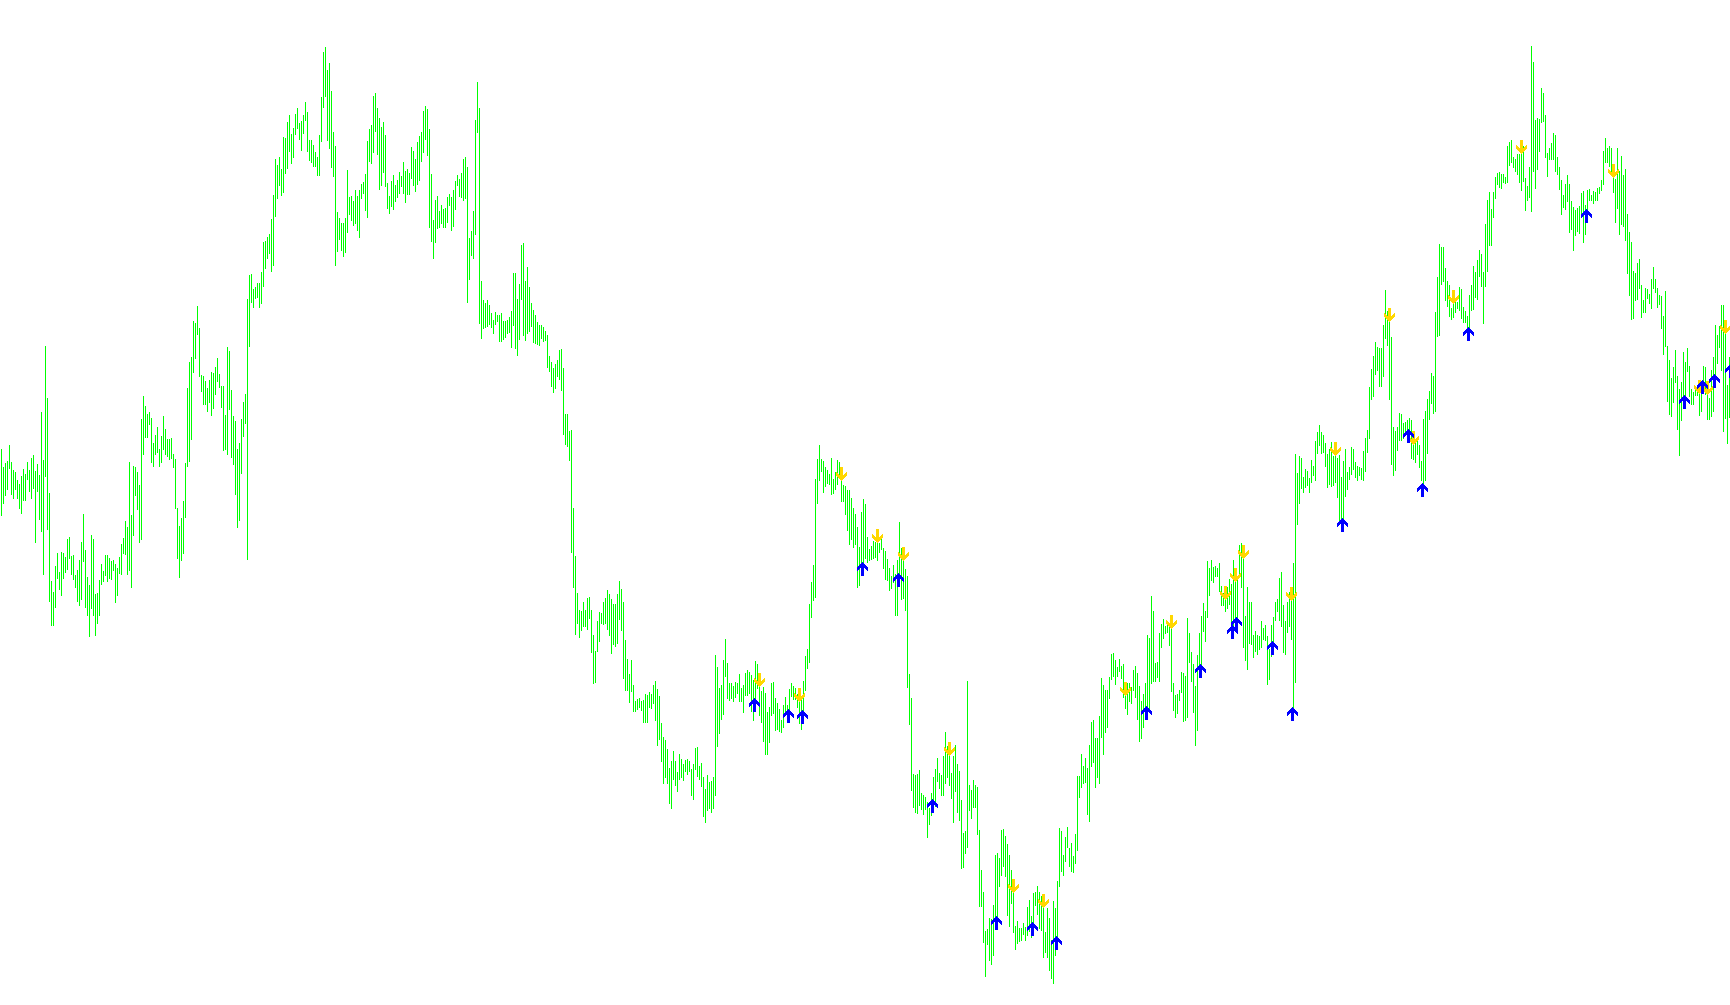
This tool is designed to help traders identify specific directional shifts in the market by monitoring price momentum. Instead of cluttering the chart with constant lines, it focuses on pinpointing the exact moments when a trend transitions from one direction to another.
Core Logic and Functionality
The script works by analyzing a momentum oscillator (specifically the Williams %R) over a set period of time. It looks at how "overbought" or "oversold" the price is relative to its recent history. By measuring these movements, the tool can distinguish between a continuing trend and a significant reversal in market sentiment.
How it Identifies Signals
The script follows a specific three-step logic to decide when to place a visual marker on your chart:
- Trend Monitoring: It constantly calculates the current momentum based on user-defined settings (the "SSP" and "Risk" variables). This allows it to establish whether the market is currently in an "uptrend" or a "downtrend" state.
- Change Detection: The script compares the current market state to the previous moment. It is specifically looking for the "flip"—the exact point where the momentum shifts from negative to positive (or vice versa).
- Visual Signaling: Once a shift is detected, the tool places an arrow on the chart:
- When the trend flips to positive, it places an Aqua arrow below the price candle.
- When the trend flips to negative, it places a Magenta arrow above the price candle.
Key Parameters for Users
To tailor the sensitivity of these signals, the script provides three main controls:
- Risk: This adjusts the threshold for the momentum flip. Increasing or decreasing this value changes how "aggressive" or "conservative" the tool is when identifying a trend change.
- SSP (Smoothing Period): This determines the window of time the script looks at to calculate momentum. A larger number will smooth out minor price fluctuations, while a smaller number will make the tool react more quickly to sudden moves.
- CountBars: This defines how much historical data the script processes on your chart, ensuring the indicator remains efficient and relevant to the visible price action.
In summary, this script acts as a trend-change filter. It filters out the "noise" of daily price movement and only alerts the trader when the underlying momentum reaches a point of significant reversal, providing clear visual cues for potential entry or exit points.
//+------------------------------------------------------------------+
//| BykovTrend_Sig.mq4
//| Ramdass - Conversion only
//+------------------------------------------------------------------+

#property indicator_chart_window
#property indicator_buffers 2
#property indicator_color1 Magenta
#property indicator_color2 Aqua

//---- input parameters
extern int RISK=3;
extern int SSP=9;
extern int CountBars=500;

//---- buffers
double val1[];
double val2[];

//+------------------------------------------------------------------+
//| Custom indicator initialization function                         |
//+------------------------------------------------------------------+
int init()
  {
   string short_name;
//---- indicator line
   IndicatorBuffers(2);
   SetIndexStyle(0,DRAW_ARROW);
   SetIndexArrow(0,234);
   SetIndexStyle(1,DRAW_ARROW);
   SetIndexArrow(1,233);
   SetIndexBuffer(0,val1);
   SetIndexBuffer(1,val2);

//----
   return(0);
  }
//+------------------------------------------------------------------+
//| BykovTrend_Sig                                                   |
//+------------------------------------------------------------------+
int start()
  {
   SetIndexDrawBegin(0,Bars-CountBars+SSP+1);
   SetIndexDrawBegin(1,Bars-CountBars+SSP+1);
   int i,counted_bars=IndicatorCounted();
   int K;
   bool uptrend,old;
   double wpr;

   K=33-RISK;
//----
   if(Bars<=SSP+1) return(0);
//---- initial zero
   if(counted_bars<SSP+1)
   {
      for(i=1;i<=0;i++) val1[CountBars-i]=0.0;
      for(i=1;i<=0;i++) val2[CountBars-i]=0.0;
   }
//----
   i=CountBars-SSP-1;
   if(counted_bars>=SSP+1) i=CountBars-counted_bars-1;
   while(i>=0)
     {

   wpr=iWPR(NULL,0,SSP,i);
   val1[i]=0.0; val2[i]=0.0;
   if (wpr<-100+K) uptrend=false;
   if (wpr>-K) uptrend=true;
   if ((! uptrend==old) && uptrend==true) {val2[i]=Low[i]-5*Point;}
   if ((! uptrend==old) && uptrend==false) {val1[i]=High[i]+5*Point;}
   old=uptrend;

      i--;
     }
   return(0);
  }
//+------------------------------------------------------------------+
Comments