nonlagdot_v2
Download script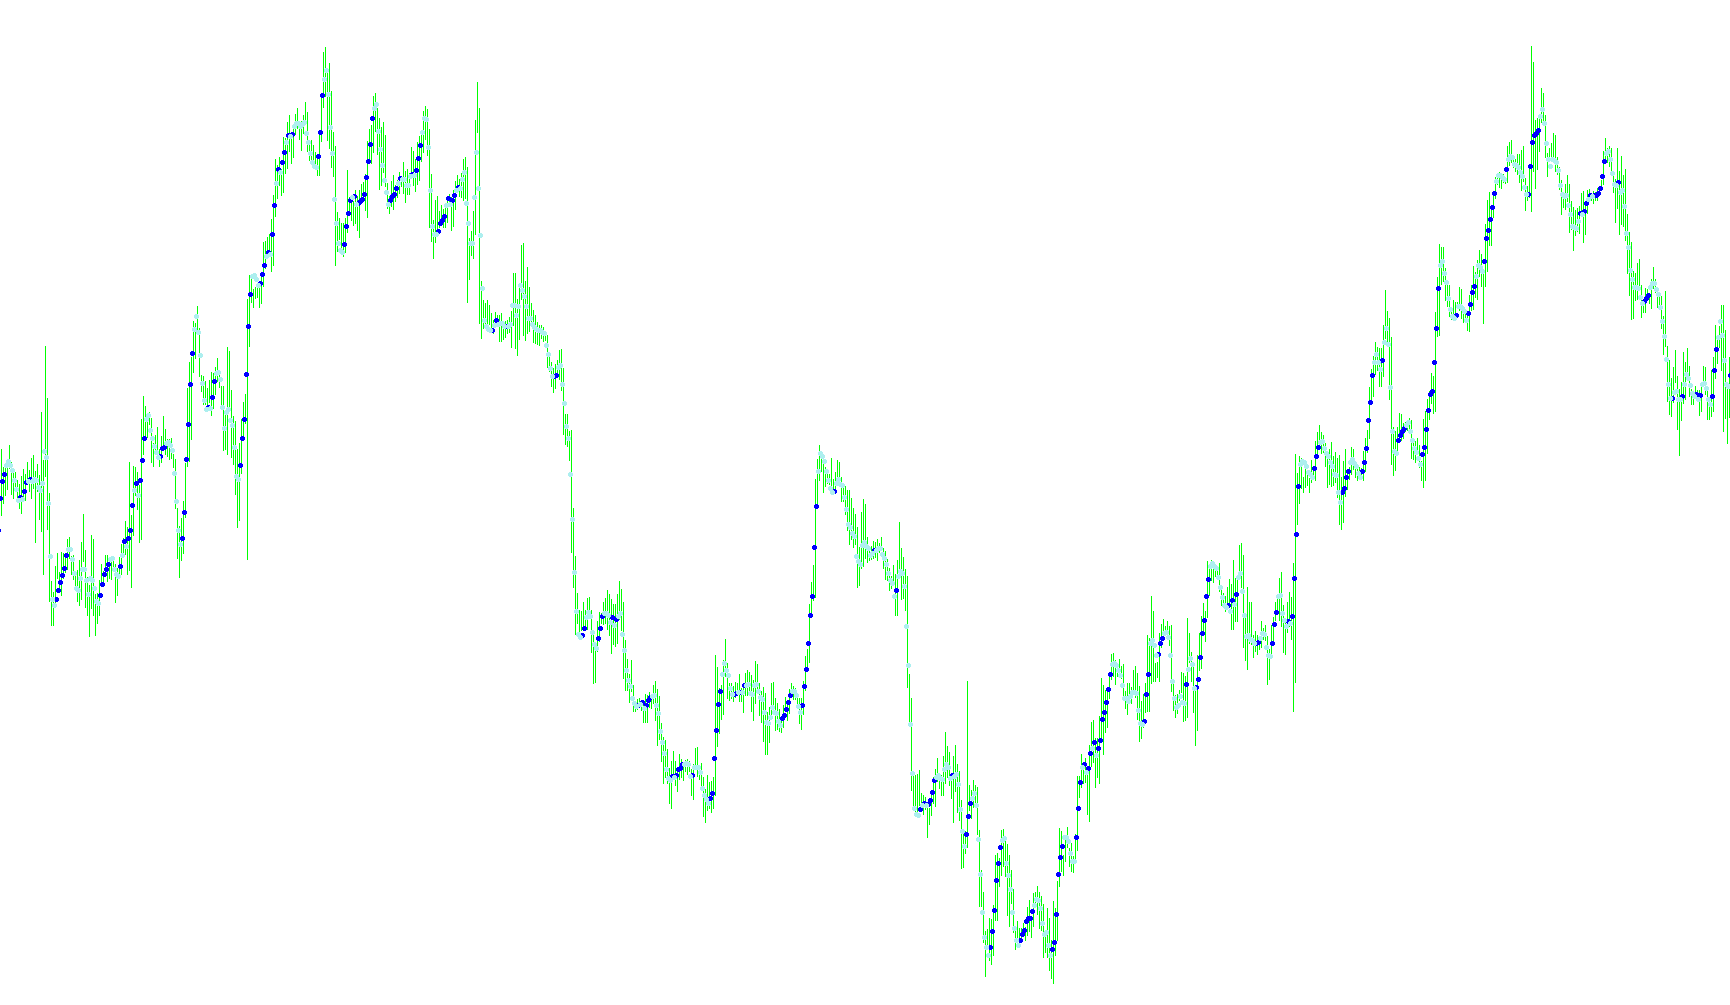
This script is designed as a technical analysis tool for trading platforms to help identify market trends while minimizing the "lag" typically associated with standard moving averages. Instead of simply averaging past prices in a linear fashion, this logic employs a sophisticated mathematical approach to smooth out price action and provide clearer visual signals for trend direction.
Core Logic and Methodology
The primary objective of the script is to calculate a specialized moving average that reacts more fluidly to current market conditions. Here is how the underlying logic operates:
1. Advanced Weighting System Unlike a standard moving average where every price point in a period might carry equal weight, this script applies a custom weighting formula. It utilizes trigonometric calculations (specifically cosine functions) and decay coefficients to assign different importance to different prices within its look-back window. This allows the tool to prioritize specific data points that are most relevant to the current trend, helping to filter out "noise" without sacrificing responsiveness.
2. Smoothing and Deviation Control The logic includes a mechanism to adjust the sensitivity of the resulting line. By incorporating a deviation parameter, users can slightly expand or contract the calculated values. Additionally, it features an optional filtering system that prevents the indicator from making erratic jumps; if a price movement is too small to be significant, the script maintains the previous value to ensure a smoother visual experience.
3. Trend Detection and Color Coding The script does not just draw a single line; it actively monitors the "momentum" of its own calculated average. It compares the current calculated value against the previous one to determine if the trend is moving upward or downward.
- Upward Trend: When the logic detects a sustained move higher than a defined threshold, it highlights the data points accordingly.
- Downward Trend: Conversely, when the movement shifts lower, the script identifies this as a bearish trend.
4. Visual Signaling (The "Dot" System) The final output on your chart is represented by specific markers (dots/arrows). The logic distinguishes between the two directions by separating them into different visual buffers. This means that as the market shifts from bullish to bearish, the script effectively "switches" which markers it displays. It also includes a "back-filling" logic that ensures color consistency across recent bars, providing a continuous and readable path for the trader to follow.
Summary for the User
In essence, this tool acts as a sophisticated "trend tracker." It processes raw price data through a trigonometric weighting filter to create a smooth average, then automatically detects the direction of that average to plot clear visual cues on your chart. It is designed to help you see where the price is heading while ignoring minor, insignificant fluctuations.
//+------------------------------------------------------------------+
//|                                                  NonLagDOT.mq4 |
//|                                Copyright © 2006, TrendLaboratory |
//|            http://finance.groups.yahoo.com/group/TrendLaboratory |
//|                                   E-mail: igorad2003@yahoo.co.uk |
//+------------------------------------------------------------------+
#property copyright "Copyright © 2006, TrendLaboratory"
#property link      "http://finance.groups.yahoo.com/group/TrendLaboratory"
//----
#property indicator_chart_window
#property indicator_buffers 3
#property indicator_color1 Yellow
#property indicator_width1 2
#property indicator_color2 RoyalBlue
#property indicator_width2 2
#property indicator_color3 Red
#property indicator_width3 2
//---- input parameters
extern int     Price         =0;
extern int     Length        =10;
extern int     Displace      =0;
extern int     Filter        =0;
extern int     Color         =1;
extern int     ColorBarBack  =2;
extern double  Deviation     =0;
//----
double Cycle= 4;
//---- indicator buffers
double MABuffer[];
double UpBuffer[];
double DnBuffer[];
double price[];
double trend[];
//+------------------------------------------------------------------+
//| Custom indicator initialization function                         |
//+------------------------------------------------------------------+
  int init()
  {
   int ft=0;
   string short_name;
//---- indicator line
   IndicatorBuffers(5);
   SetIndexStyle(0,DRAW_ARROW);
   SetIndexBuffer(0,MABuffer);
   SetIndexStyle(1,DRAW_ARROW);
   SetIndexBuffer(1,UpBuffer);
   SetIndexStyle(2,DRAW_ARROW);
   SetIndexBuffer(2,DnBuffer);
   SetIndexBuffer(3,price);
   SetIndexBuffer(4,trend);
   IndicatorDigits(MarketInfo(Symbol(),MODE_DIGITS));
   SetIndexArrow(0,159);
   SetIndexArrow(1,159);
   SetIndexArrow(2,159);
   SetIndexArrow(3,159);
//---- name for DataWindow and indicator subwindow label
   short_name="NonLagDot("+Length+")";
   IndicatorShortName(short_name);
   SetIndexLabel(0,"NLD");
   SetIndexLabel(1,"Up");
   SetIndexLabel(2,"Dn");
//----
   SetIndexShift(0,Displace);
   SetIndexShift(1,Displace);
   SetIndexShift(2,Displace);

   SetIndexDrawBegin(0,Length*Cycle+Length);
   SetIndexDrawBegin(1,Length*Cycle+Length);
   SetIndexDrawBegin(2,Length*Cycle+Length);
//----
   return(0);
  }
//+------------------------------------------------------------------+
//| NonLagMA_v4                                                      |
//+------------------------------------------------------------------+
int start()
  {
   int    i,shift, counted_bars=IndicatorCounted(),limit;
   double alfa, beta, t, Sum, Weight, step,g;
   double pi=3.1415926535;
//----
   double Coeff= 3*pi;
   int Phase=Length-1;
   double Len=Length*Cycle + Phase;
//----
   if(counted_bars > 0) limit=Bars-counted_bars;
   if(counted_bars < 0) return(0);
   if(counted_bars ==0) limit=Bars-Len-1;
   if(counted_bars < 1)
      for(i=1;i<Length*Cycle+Length;i++)
        {
         MABuffer[Bars-i]=0;
         UpBuffer[Bars-i]=0;
         DnBuffer[Bars-i]=0;
        }
   for(shift=limit;shift>=0;shift--)
     {
      Weight=0; Sum=0; t=0;
      for(i=0;i<=Len-1;i++)
        {
         g=1.0/(Coeff*t+1);
         if (t<=0.5)g=1;
         beta=MathCos(pi*t);
         alfa=g * beta;
         //if (shift>=1) price[i] = iMA(NULL,0,Per,Displace,Mode,Price,shift+i);
         //else
         price[i]=iMA(NULL,0,1,0,MODE_SMA,Price,shift+i);
         Sum+=alfa*price[i];
         Weight+=alfa;
         if(t < 1)t+=1.0/(Phase-1);
         else if(t < Len-1) t+=(2*Cycle-1)/(Cycle*Length-1);
        }
      if (Weight > 0) MABuffer[shift]=(1.0+Deviation/100)*Sum/Weight;
      if (Filter>0)
        {
         if(MathAbs(MABuffer[shift]-MABuffer[shift+1]) < Filter*Point)MABuffer[shift]=MABuffer[shift+1];
        }
      if (Color>0)
        {
         trend[shift]=trend[shift+1];
         if (MABuffer[shift]-MABuffer[shift+1] > Filter*Point) trend[shift]= 1;
         if (MABuffer[shift+1]-MABuffer[shift] > Filter*Point) trend[shift]=-1;
         if (trend[shift]>0)
           {
            UpBuffer[shift]=MABuffer[shift];
            if (trend[shift+ColorBarBack]<0) UpBuffer[shift+ColorBarBack]=MABuffer[shift+ColorBarBack];
            DnBuffer[shift]=EMPTY_VALUE;
           }
         if (trend[shift]<0)
           {
            DnBuffer[shift]=MABuffer[shift];
            if (trend[shift+ColorBarBack]>0) DnBuffer[shift+ColorBarBack]=MABuffer[shift+ColorBarBack];
            UpBuffer[shift]=EMPTY_VALUE;
           }
        }
     }
   //----
   return(0);
  }
//+------------------------------------------------------------------+
Comments