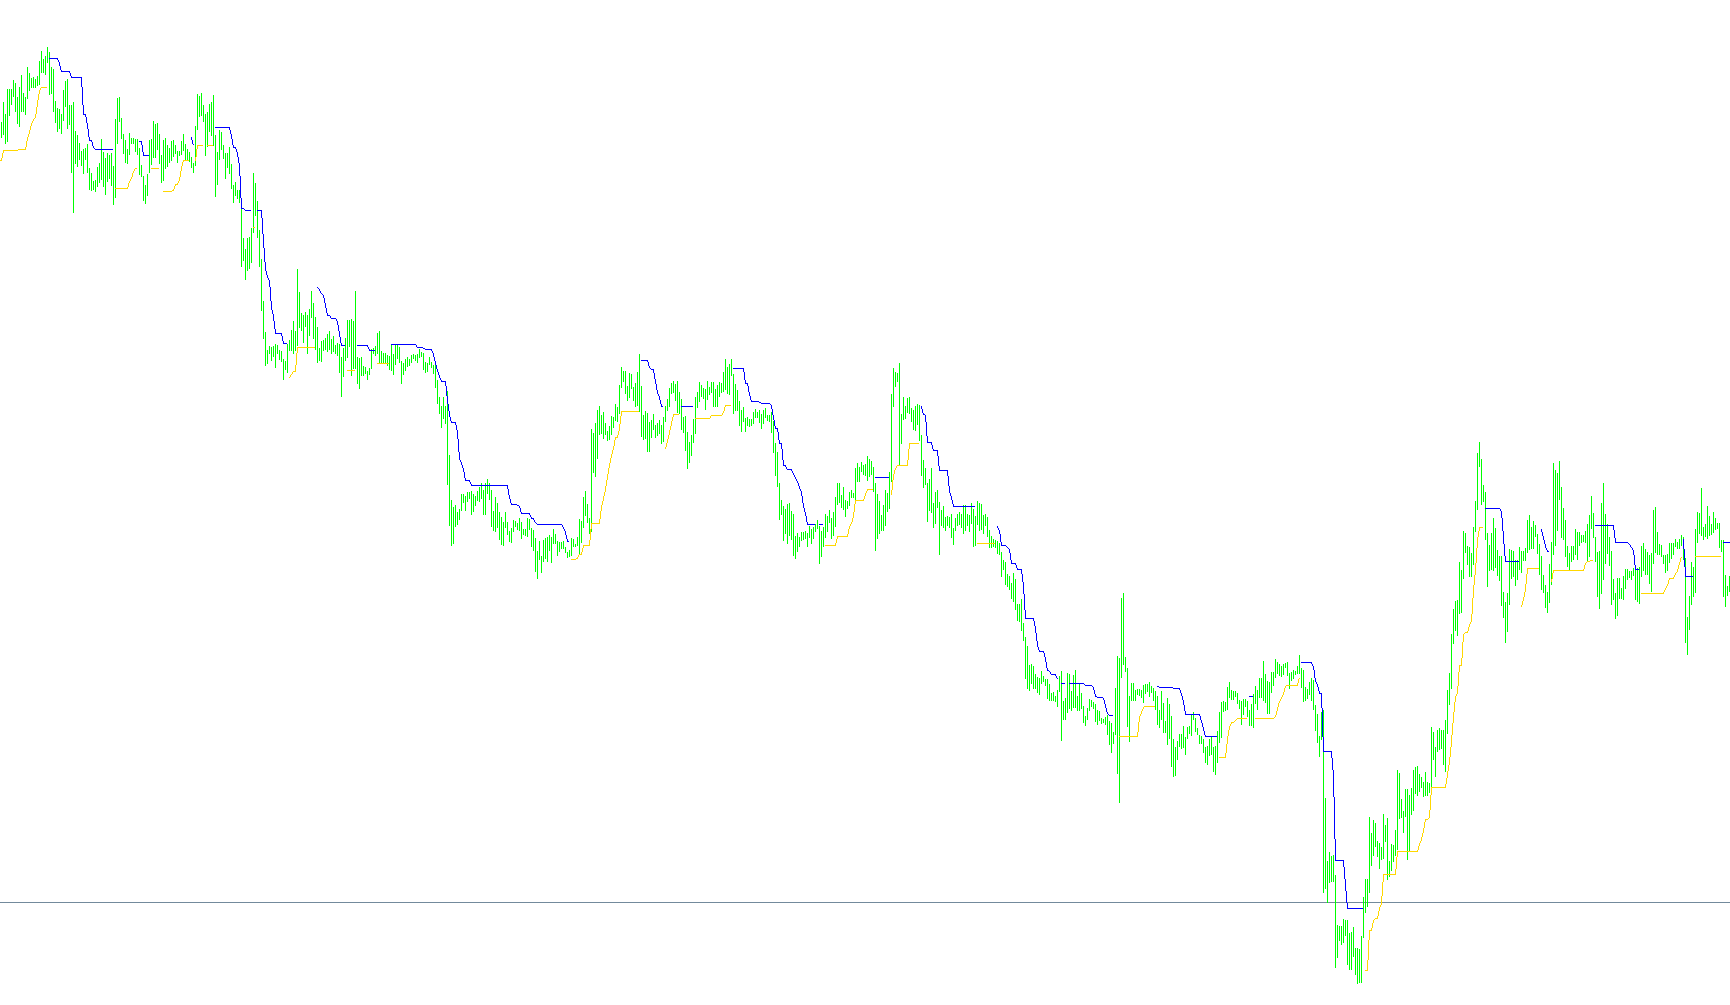
This technical indicator is designed to help traders identify market trends and establish dynamic "stop-loss" levels based on actual market volatility. Instead of using a fixed price point, it adapts to the current speed and "noise" of the market, making it particularly useful for identifying when a trend has fundamentally shifted.
How the Logic Works
1. Volatility Measurement The script begins by looking at the Average True Range (ATR). In simple terms, the ATR measures how much a price typically moves over a specific period. By multiplying this volatility by a user-defined multiplier, the tool creates a "buffer zone" around the price. This ensures that minor, insignificant price flickers don't trigger a trend change prematurely.
2. Establishing the Boundary The indicator scans back through a set number of previous candles to find the highest and lowest possible points based on that volatility buffer. It effectively calculates a "safety zone." It looks for the most extreme boundaries that the price has touched recently, creating a floor (support) and a ceiling (resistance).
3. Trend Detection The script monitors the closing price of the candles relative to these calculated boundaries:
- Bullish Trend: If the price closes significantly above the previous "ceiling," the indicator recognizes an upward trend.
- Bearish Trend: If the price closes significantly below the previous "floor," it recognizes a downward trend.
4. Dynamic Adjustment One of the key features of this logic is how it handles the trend lines:
- In an Upward Trend, the indicator tracks the floor. If the new floor calculated by the script is lower than the previous one, it holds onto the higher level. This prevents the "stop" line from moving down in your favor during a rally.
- In a Downward Trend, the indicator tracks the ceiling. It ensures that as the price drops, the "resistance" line only moves upward (tightening) rather than falling with the price.
Visual Summary for the User
On your chart, this tool will display two distinct lines:
- The Upper Line (Blue): This appears during an uptrend. It acts as a trailing support level; as long as the price stays above this line, the trend is considered intact.
- The Lower Line (Red): This appears during a downtrend. It acts as a trailing resistance level; as long as the price remains below this line, the bearish momentum is considered to be continuing.
By using this logic, traders can visualize where a trend might be "breaking" and set more objective, volatility-adjusted exit points rather than relying on arbitrary price levels.
//+------------------------------------------------------------------+
//|                                                  ATRStops_v1.mq4 |
//|                                  Copyright © 2006, Forex-TSD.com |
//|                         Written by IgorAD,igorad2003@yahoo.co.uk |
//|            http://finance.groups.yahoo.com/group/TrendLaboratory |
//+------------------------------------------------------------------+
#property copyright "Copyright © 2006, Forex-TSD.com "
#property link      "http://www.forex-tsd.com/"
//----
#property indicator_chart_window
#property indicator_buffers 2
#property indicator_color1 Blue
#property indicator_color2 Red
//---- input parameters
extern int    Length=10;
extern int    ATRperiod=5;
extern double Kv=2.5;
//---- indicator buffers
double UpBuffer1[];
double DnBuffer1[];
double smin[];
double smax[];
double trend[];
//+------------------------------------------------------------------+
//| Custom indicator initialization function                         |
//+------------------------------------------------------------------+
  int init()
  {
   string short_name;
//---- indicator line
   SetIndexStyle(0,DRAW_LINE);
   SetIndexStyle(1,DRAW_LINE);
   IndicatorBuffers(5);
   SetIndexBuffer(0,UpBuffer1);
   SetIndexBuffer(1,DnBuffer1);
   SetIndexBuffer(2,smin);
   SetIndexBuffer(3,smax);
   SetIndexBuffer(4,trend);
//---- name for DataWindow and indicator subwindow label
   short_name="ATRStops("+Length+")";
   IndicatorShortName(short_name);
   SetIndexLabel(0,"Up");
   SetIndexLabel(1,"Dn");
//----
   SetIndexDrawBegin(0,Length);
   SetIndexDrawBegin(1,Length);
//----
   return(0);
  }
//+------------------------------------------------------------------+
//| ATRStops_v1                                                      |
//+------------------------------------------------------------------+
int start()
  {
   int shift,limit, counted_bars=IndicatorCounted();
//----
   if(counted_bars > 0) limit=Bars-counted_bars;
   if(counted_bars < 0) return(0);
   if(counted_bars ==0) limit=Bars-Length-1;
//----
   for(shift=limit;shift>=0;shift--)
     {
      smin[shift]=-100000; smax[shift]=100000;
      for(int i=Length-1;i>=0;i--)
        {
         smin[shift]=MathMax( smin[shift], High[shift+i] - Kv*iATR(NULL,0,ATRperiod,shift+i));
         smax[shift]=MathMin( smax[shift], Low[shift+i] + Kv*iATR(NULL,0,ATRperiod,shift+i));
        }
      trend[shift]=trend[shift+1];
      if(Close[shift] > smax[shift+1])trend[shift]= 1;
      if(Close[shift] < smin[shift+1])trend[shift]=-1;
      if(trend[shift] >0)
        {
         if(smin[shift]<smin[shift+1])smin[shift]=smin[shift+1];
         UpBuffer1[shift]=smin[shift];
         DnBuffer1[shift]=EMPTY_VALUE;
        }
      if(trend[shift] <0)
        {
         if(smax[shift]>smax[shift+1])smax[shift]=smax[shift+1];
         UpBuffer1[shift]=EMPTY_VALUE;
         DnBuffer1[shift]=smax[shift];
        }
     }
   return(0);
  }
//+------------------------------------------------------------------+
Comments