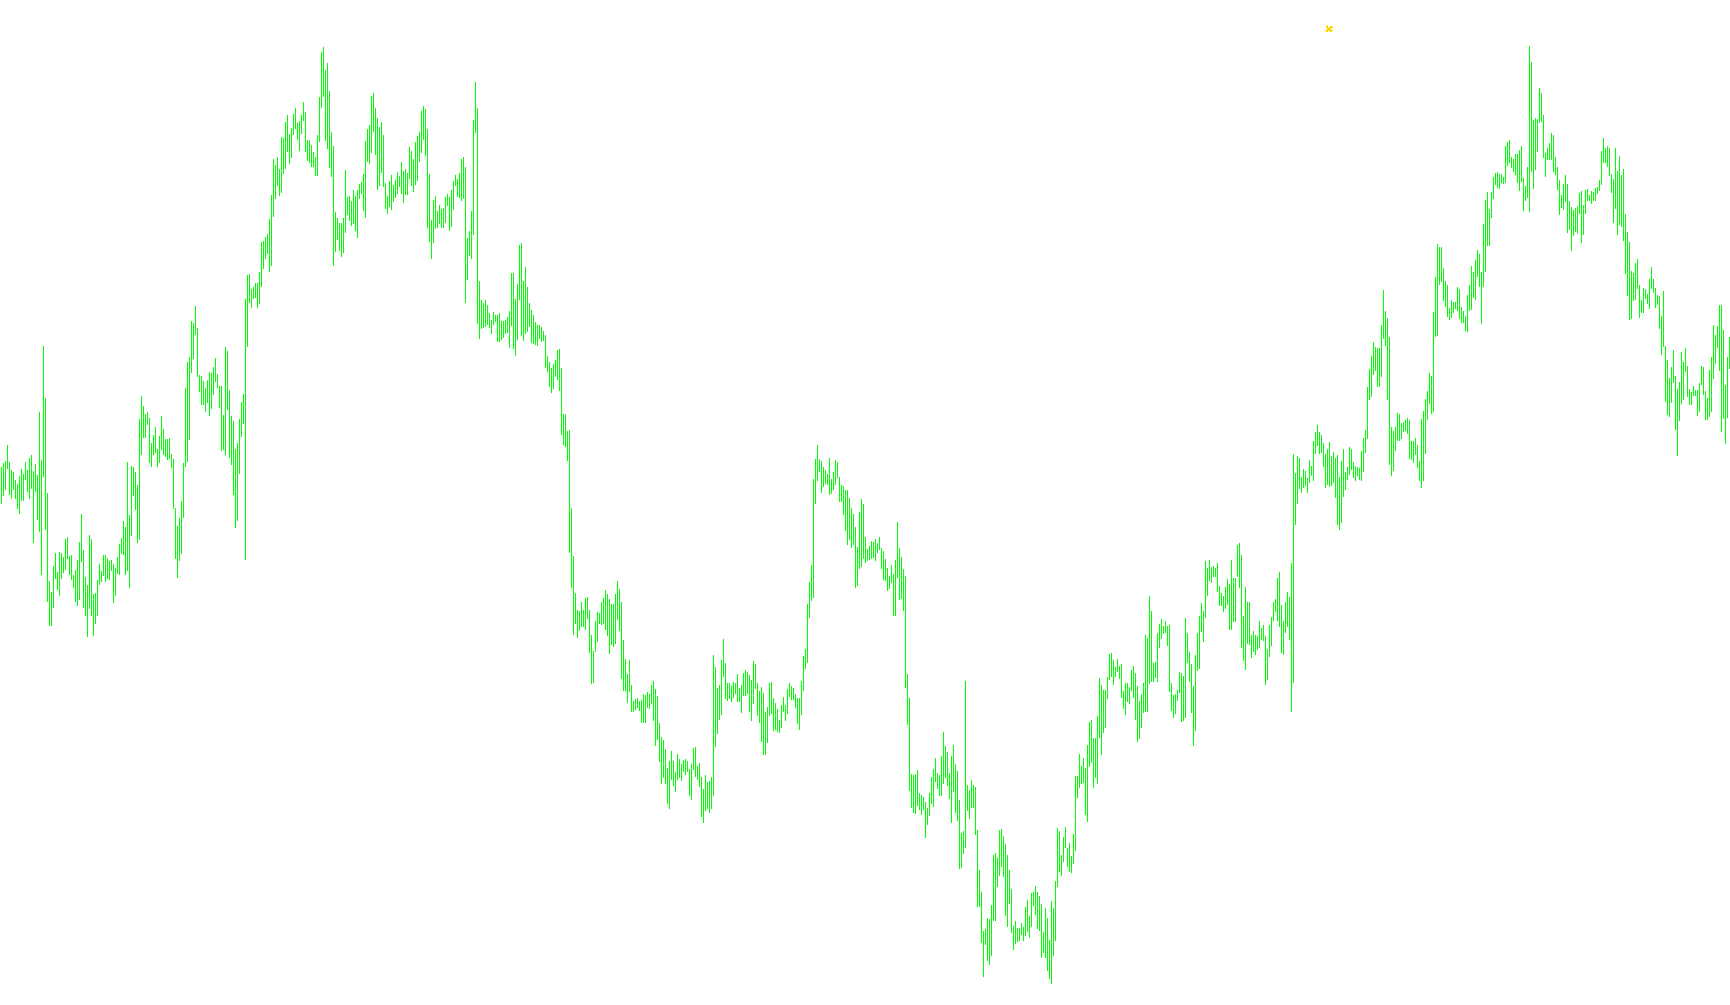
The NRTR script is a specialized technical analysis tool designed to help traders identify potential trend reversals and calculate dynamic "Stop Loss" levels. By analyzing historical price action, the script projects specific price points on your chart to signal when a current market trend might be exhausting itself or switching directions.
Core Logic Overview
The primary goal of this tool is to determine the "breaking point" of a trend based on volatility and price movement. It does this by calculating a dynamic percentage offset (the dK value), which is derived from the average range of candles over a set period. This ensures that the signals adapt to the current market environment—shrinking during calm periods and expanding during high-volatility sessions.
How it Works
The script functions using two distinct modes, depending on how you prefer to define the "price" of an asset:
1. Opening vs. Closing Price Mode (Default) In this mode, the logic focuses on the relationship between the opening and closing prices of candles.
- It identifies the prevailing trend based on whether the price closed higher or lower than it opened at a specific starting point in history.
- As new data comes in, it tracks the highest "price" reached during an upward trend or the lowest during a downward trend.
- If the current market price breaches a calculated threshold (based on that historical high/low and the volatility offset), the script flips its trend detection.
- It then plots visual markers for Buy and Sell levels on your chart.
2. High vs. Low Price Mode (Alternative) If you prefer a more balanced view of price action, this mode uses the midpoint of each candle (the average of the High and Low prices) rather than just the close.
- The logic follows the same principle: it tracks the "midpoint" progression.
- It detects shifts by observing when the midpoint of the current movement fails to stay above or below the previously established volatility threshold.
- This provides a slightly different perspective on trend exhaustion, focusing on the total range of the candle's movement.
Key Features for Traders
- Dynamic Alerts: The script is programmed to monitor the most recent price updates. If the calculated Stop Loss level changes significantly, it triggers an audible alert to notify you of the new trend direction in real-time.
- Trend Identification: Instead of just showing a static line, the script visually separates "Buy" and "Sell" levels using different colors (Blue, Red, Magenta, and Yellow), making it easier to identify which direction the logic is currently favoring.
- Historical Context: The tool doesn't just look at the current candle; it processes a significant amount of historical data (up to 200 bars) to ensure that the trend detection is rooted in recent market behavior.
Summary of User Experience
For a visitor using this tool, the NRTR acts as a "trend guard." It automatically monitors the market's volatility and price history to plot out specific levels where a trend might fail. When the price crosses these calculated zones, the script updates its visual markers and alerts you, providing a systematic way to manage risk and identify potential entry or exit points.
//+------------------------------------------------------------------+
//|                                                         NRTR.mq4 |
//|            Copyright © 2005, VG many thanks to Konkop and dupidu |
//|                                                      4vg@mail.ru |
//+------------------------------------------------------------------+
#property copyright "VG many thanks to Konkop and dupidu"

#property indicator_chart_window
#property  indicator_buffers 4
#property  indicator_color1  Blue
#property  indicator_color2  Red
#property  indicator_color3  Magenta
#property  indicator_color4  Yellow


double     ind_buffer1[];
double     ind_buffer2[];
double     ind_buffer3[];
double     ind_buffer4[];

extern double AveragePeriod = 40;
extern bool OCnotAverage = true;
extern int MaxBarsToCount = 200;
//+------------------------------------------------------------------+
//| Custom indicator initialization function                         |
//+------------------------------------------------------------------+
int init()
  {
//---- drawing settings
   SetIndexStyle(0,DRAW_ARROW,STYLE_SOLID,1);
   SetIndexDrawBegin(0,AveragePeriod);
   SetIndexStyle(1,DRAW_ARROW,STYLE_SOLID,1);
   SetIndexDrawBegin(1,AveragePeriod);
   SetIndexStyle(2,DRAW_ARROW,STYLE_SOLID,3);
   SetIndexDrawBegin(2,AveragePeriod);
   SetIndexStyle(3,DRAW_ARROW,STYLE_SOLID,3);
   SetIndexDrawBegin(3,AveragePeriod);

//---- indicator buffers mapping
   if(!SetIndexBuffer(0,ind_buffer1) && !SetIndexBuffer(1,ind_buffer2)
      && !SetIndexBuffer(2,ind_buffer3)&& !SetIndexBuffer(3,ind_buffer4))
      Print("cannot set indicator buffers!");
//---- name for DataWindow and indicator subwindow label
   IndicatorShortName("NRTR");
   SetIndexLabel(0,"Sell S/L");
   SetIndexLabel(1,"Buy S/L");
   SetIndexLabel(2,"Sell S/L");
   SetIndexLabel(3,"Buy S/L");

//---- initialization done
   return(0);
  }
//+------------------------------------------------------------------+
//| Custor indicator deinitialization function                       |
//+------------------------------------------------------------------+
int deinit()
  {
//---- TODO: add your code here

//----
   return(0);
  }
//+------------------------------------------------------------------+
//| Custom indicator iteration function                              |
//+------------------------------------------------------------------+
int start()
  {
   int bar, limit, PrevAlertTime;
   double value = 0;
   double price = 0;
   double trend, dK, AvgRange, HLTrend;
//---- TODO: add your code here
   if(Bars<=MaxBarsToCount) return(-1);

for (int shift=MaxBarsToCount; shift>=0; shift--)
    {
    ind_buffer1[shift]=0;
    ind_buffer2[shift]=0;
    ind_buffer3[shift]=0;
    ind_buffer4[shift]=0;
    }

AvgRange=0;
for (int i=1; i<=AveragePeriod; i++) AvgRange+= MathAbs(High[i]-Low[i]);
dK = AvgRange/AveragePeriod/Point/10000;

if (OCnotAverage)
{
if (Close[MaxBarsToCount] > Open[MaxBarsToCount])
   {
   value = Close[MaxBarsToCount] * (1 - dK);
   trend = 1;
   ind_buffer2[MaxBarsToCount] = value;
   }
if (Close[MaxBarsToCount] < Open[MaxBarsToCount])
   {
   value = Close[MaxBarsToCount] * (1 + dK);
   trend = -1;
   ind_buffer1[MaxBarsToCount] = value;
   }
for (bar = MaxBarsToCount - 1; bar >= 0; bar--)
    {
    if (trend >= 0)
       {
       if (Low[bar] > price)  price = Close[bar];
       value = price * (1 - dK);
       if (Close[bar] < value)
          {
          price = Close[bar];
          value = price * (1 + dK);
          trend = -1;
          }
       }
    else
    if (trend <= 0)
       {
       if (High[bar] < price) price = Close[bar];
       value = price * (1 + dK);
       if (Close[bar] > value)
          {
          price = Close[bar];
          value = price * (1 - dK);
          trend = 1;
          }
       }
    if (trend == -1) ind_buffer1[bar] = value;
    if (trend == 1) ind_buffer2[bar] = value;
    }
    if (CurTime() - PrevAlertTime > Period()*60)
    {
    if ((ind_buffer1[0] != ind_buffer1[1]) || (ind_buffer2[0] != ind_buffer2[1]))
       {
       Alert("Íîâûé S/L íà ",value);
       PrevAlertTime = CurTime();
       }
    }

}
else
{
if ((High[MaxBarsToCount] + Low[MaxBarsToCount])/2 > (High[MaxBarsToCount-1] + Low[MaxBarsToCount-1])/2)
   {
   value = (High[MaxBarsToCount] + Low[MaxBarsToCount])/2 * (1 - dK);
   HLTrend = 1;
   ind_buffer4[MaxBarsToCount] = value;
   }
   else
   {
   value = (High[MaxBarsToCount] + Low[MaxBarsToCount])/2 * (1 + dK);
   HLTrend = -1;
   ind_buffer3[MaxBarsToCount] = value;
   }
for (bar = MaxBarsToCount - 1; bar >= 0; bar--)
    {
    if (HLTrend >= 0)
       {
       if (Low[bar] > price) price = (High[bar] + Low[bar])/2;
       value = price * (1 - dK);
       if ((High[bar] + Low[bar])/2 < value)
          {
          price = (High[bar] + Low[bar])/2;
          value = price * (1 + dK);
          HLTrend = -1;
          }
       }
    else
    if (HLTrend <= 0)
       {
       if (High[bar] < price) price = (High[bar] + Low[bar])/2;
       value = price * (1 + dK);
       if ((High[bar] + Low[bar])/2 > value)
          {
          price = (High[bar] + Low[bar])/2;
          value = price * (1 - dK);
          HLTrend = 1;
          }
       }
    if (HLTrend == -1) ind_buffer3[bar] = value;
    if (HLTrend == 1) ind_buffer4[bar] = value;
    }
    if (CurTime() - PrevAlertTime > Period()*60)
    {
    if ((ind_buffer3[0] != ind_buffer3[1]) || (ind_buffer4[0] != ind_buffer4[1]))
       {
       Alert("Íîâûé S/L íà ",value);
       PrevAlertTime = CurTime();
       }
    }
}

//----
   return(0);
  }
//+------------------------------------------------------------------+
Comments