T.S.V._Bullish & Bearish
Download script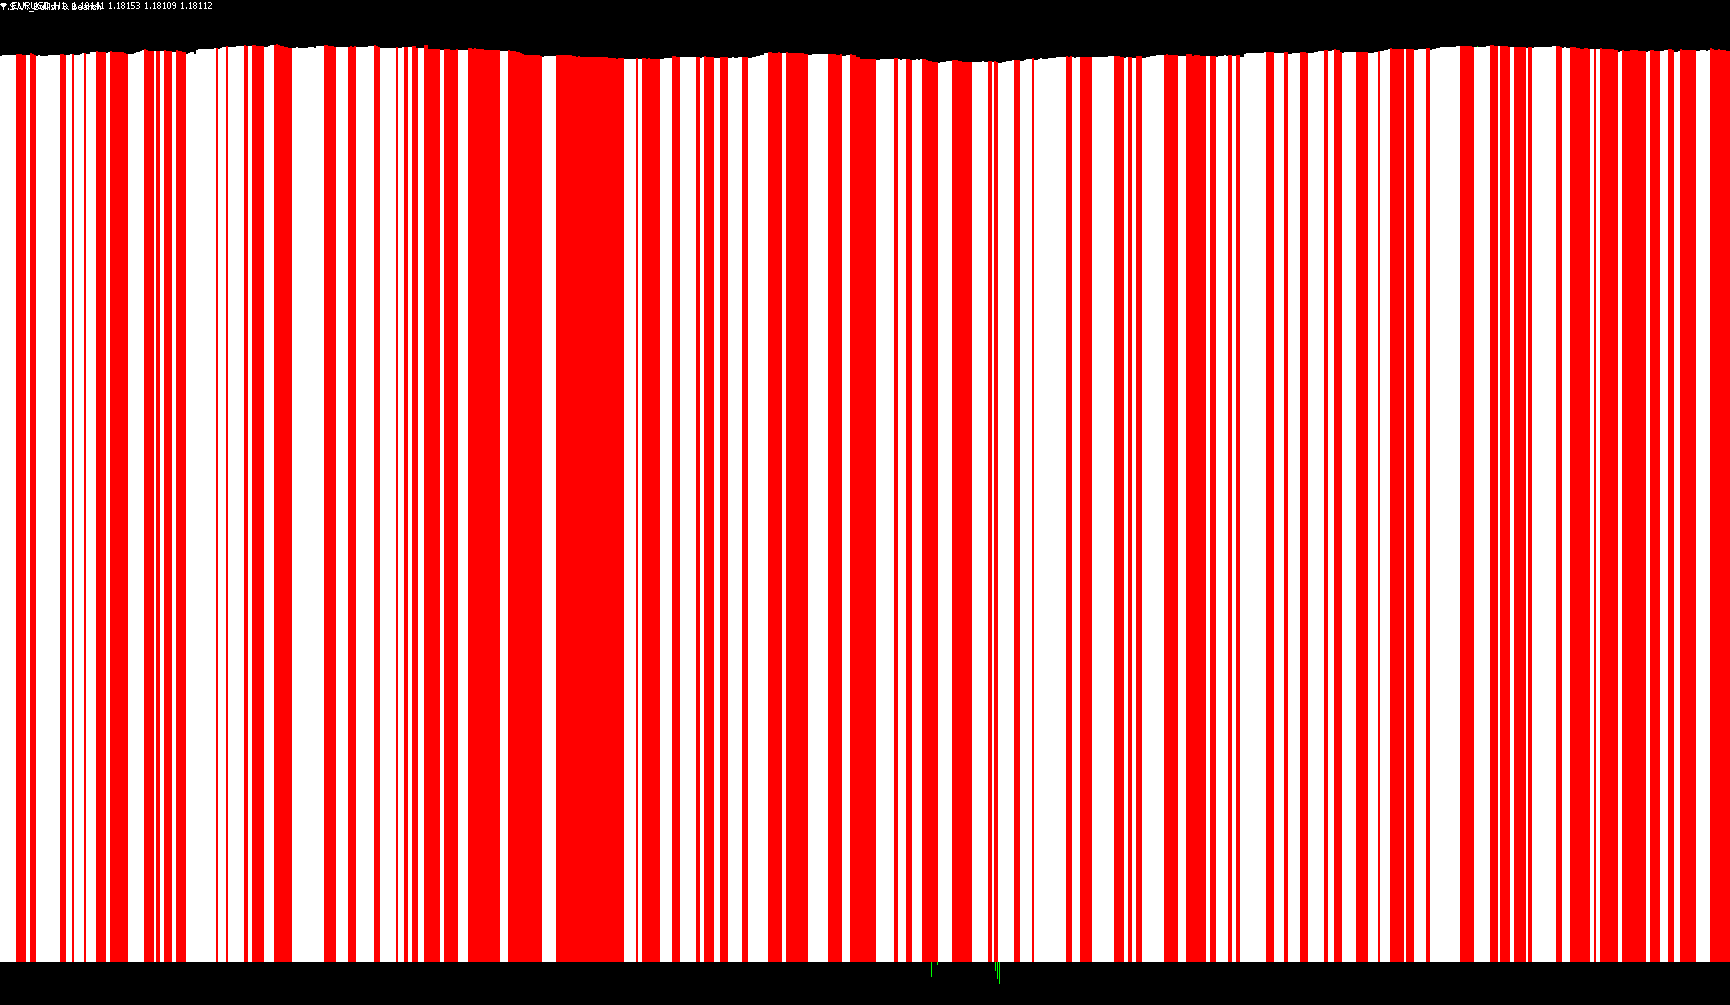
This technical indicator is designed to provide visual signals regarding market momentum by identifying shifts between "Bullish" and "Bearish" price actions. Instead of cluttering the main price chart, it operates in a separate window, creating a distinct histogram that highlights potential trend transitions.
Core Logic and Methodology
The script functions by analyzing the relationship between the current closing price and specific moving averages based on the highest and lowest prices reached during a set period. Here is how the logic flows:
1. Price Boundary Analysis The tool calculates two distinct boundaries:
- An upper boundary based on the highest prices over a specific timeframe.
- A lower boundary based on the lowest prices over the same timeframe.
These boundaries act as "zones" to determine whether the current market sentiment is leaning toward the upside or the downside.
2. Trend Detection (The Switch) The logic monitors the closing price of each candle relative to these boundaries:
- Bullish State: When the price moves above the upper boundary, the script registers a shift in momentum toward a bullish trend.
- Bearish State: When the price drops below the lower boundary, the script registers a shift toward a bearish trend.
The indicator is designed to "latch" onto these states. It doesn't simply change colors every time a candle flickers across a line; rather, it tracks the persistence of the move. A change in direction is only confirmed when the price establishes itself decisively on the opposite side of the respective boundary.
3. Visual Representation The results are displayed as a solid histogram in two primary colors:
- Forest Green: Represents periods where the market logic identifies a Bullish bias.
- Red: Represents periods where the market logic identifies a Bearish bias.
By observing these color blocks, traders can see the historical flow of market sentiment. When the histogram switches from green to red (or vice versa), it signifies that the price has broken through a key threshold, suggesting a potential shift in market direction.
//+------------------------------------------------------------------+
//|                                     T.S.V._Bullish & Bearish.mq4 |
//|                                                    Sergey_T.S.V. |
//|                                                       &&&&&&&&&& |
//+------------------------------------------------------------------+
#property copyright "Sergey_T.S.V."
#property  indicator_separate_window
#property indicator_buffers 3
#property indicator_color1  Blue
#property indicator_color2 Red
#property indicator_color3 ForestGreen
extern int period=1;int CountBars=3000;
double ExtBuffer0[];double ExtBuffer1[];double ExtBuffer2[];double Up[];double Down[];
int init(){
   IndicatorBuffers(3);
   SetIndexStyle(0,DRAW_NONE);
   SetIndexStyle(1,DRAW_HISTOGRAM,STYLE_SOLID,4,Red);
   SetIndexStyle(2,DRAW_HISTOGRAM,STYLE_SOLID,4,ForestGreen);IndicatorDigits(Digits+1);
   SetIndexBuffer(0,ExtBuffer0);SetIndexBuffer(1,ExtBuffer1);SetIndexBuffer(2,ExtBuffer2);
   SetIndexBuffer(1,Up);SetIndexBuffer(2,Down);SetIndexLabel(1,NULL);SetIndexLabel(2,NULL);
   return(0);}
int start(){
   SetIndexDrawBegin(1,Bars-CountBars+period);SetIndexDrawBegin(2,Bars-CountBars+period);
   int i,counted_bars=IndicatorCounted();bool Pr=false,PrevPr=false;double val,val2;
   if(CountBars<=period)return(0);if(counted_bars<1){ for(i=1;i<=period;i++)Up[CountBars-i]=0.0;
   for(i=1;i<=period;i++)Down[CountBars-i]=0.0;}i=CountBars-period-1;while(i>=0){
   val=iMA(NULL,0,period,1,MODE_SMA,PRICE_HIGH,i);val2=iMA(NULL,0,period,1,MODE_SMA,PRICE_LOW,i);
   if (Close[i]<val2 && PrevPr==true)Pr=false;if (Close[i]>val && PrevPr==false)Pr=true;
   PrevPr=Pr;Up[i]=0.0;Down[i]=0.0;if (Pr==false)Up[i] = val+2*Point;
   if (Pr==true)Down[i] = val2-2*Point; i--; }
   return(0);}
//+------------------------------------------------------------------+
Comments